TYRE MODELLING
Pacejka Magic Formula

VEHICLE DYNAMICS · MATLAB · SIMULINK
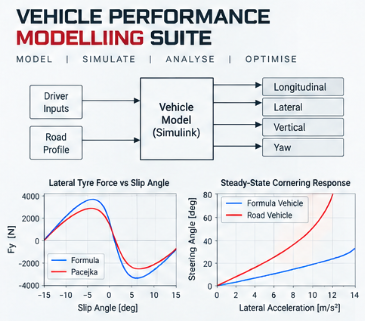
A progressively developed collection of MATLAB and Simulink models used to investigate tyre behaviour, lateral and longitudinal vehicle dynamics, braking performance and powertrain-driven acceleration.
00
MODEL ARCHITECTURE
Pacejka Magic Formula
Bicycle Model
Longitudinal Dynamics
Powertrain & Acceleration
In Development
Coming Soon
01
TYRE MODELLING
NONLINEAR TYRE FORCE · PARAMETERISATION · MODEL VERIFICATION
How can nonlinear tyre-force generation be represented in a reusable subsystem for integration into subsequent vehicle-dynamics models?
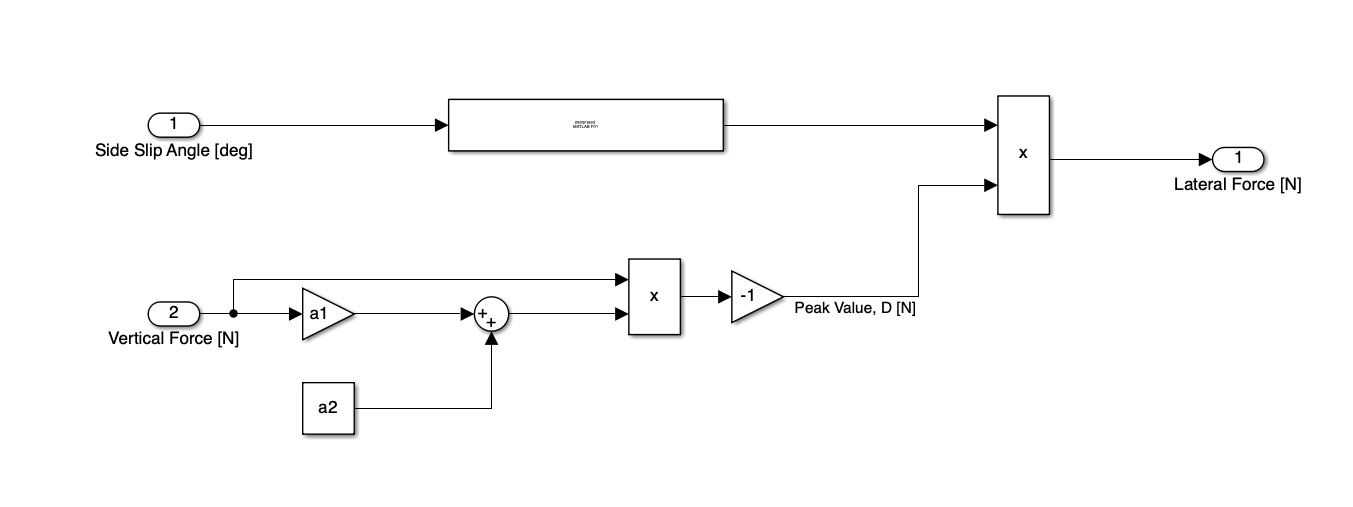
The tyre model was parameterised externally using MATLAB data, avoiding hard-coded vehicle-specific values inside the Simulink architecture. This allows the same subsystem to be reused with different tyre coefficient sets and operating conditions.
Determine tyre coefficients and peak-value parameters.
Load model parameters through a MATLAB
.m
file.
Evaluate the Magic Formula inside the Simulink subsystem.
Return lateral or longitudinal tyre force depending on the slip input.
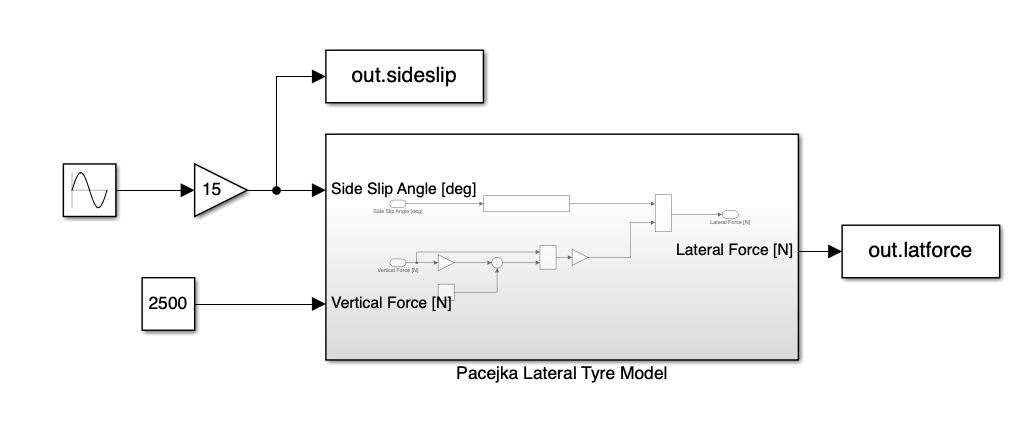
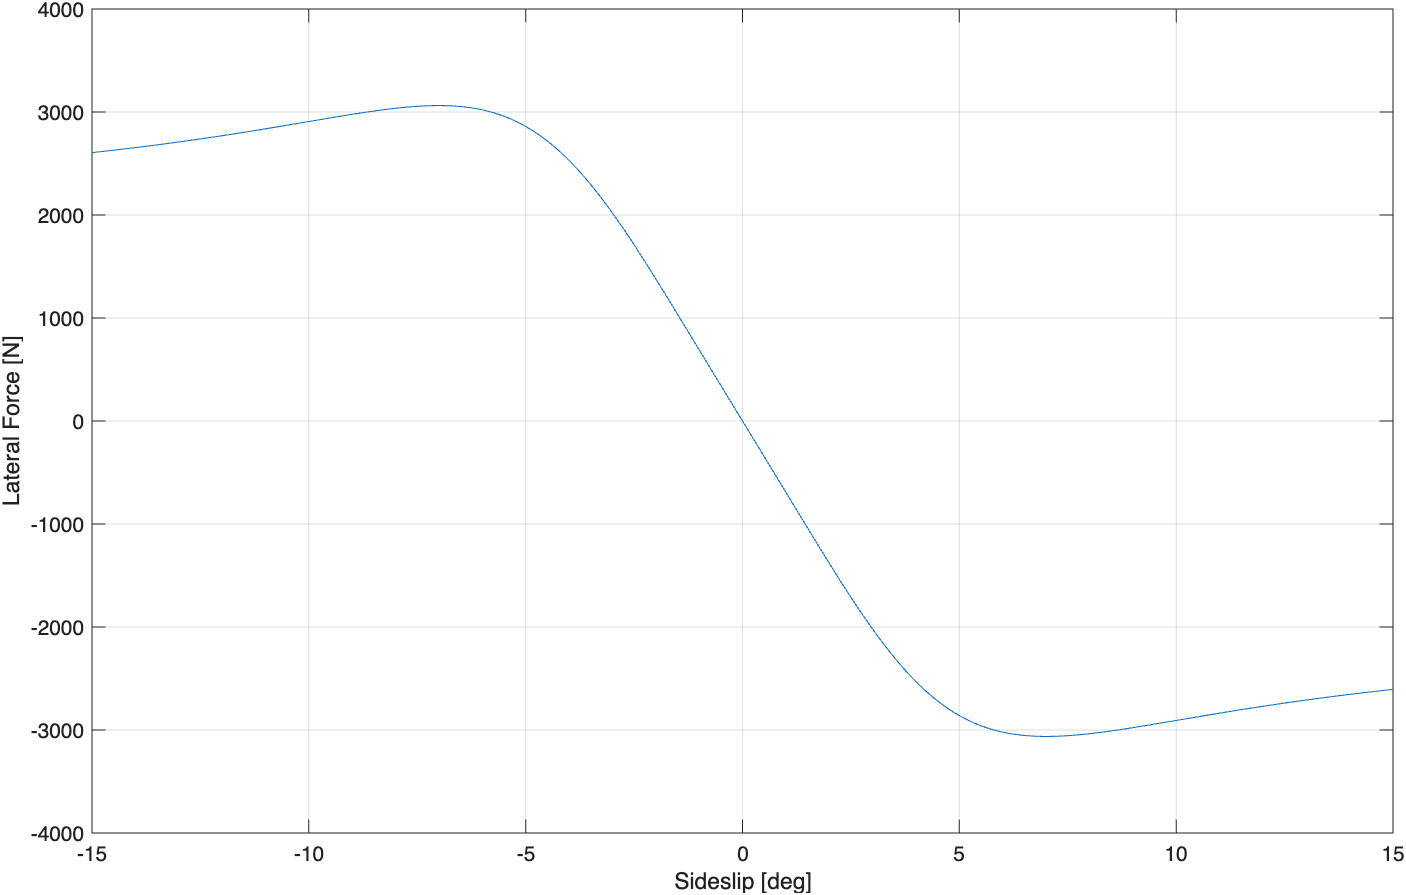
A sinusoidal sideslip input between approximately ±15° was applied at a constant 2500 N vertical load. Input and output channels were exported to the MATLAB workspace for post-processing.
This allowed the complete nonlinear force-slip characteristic to be checked before the tyre subsystem was reused in the larger vehicle models.
NUMERICAL VERIFICATION
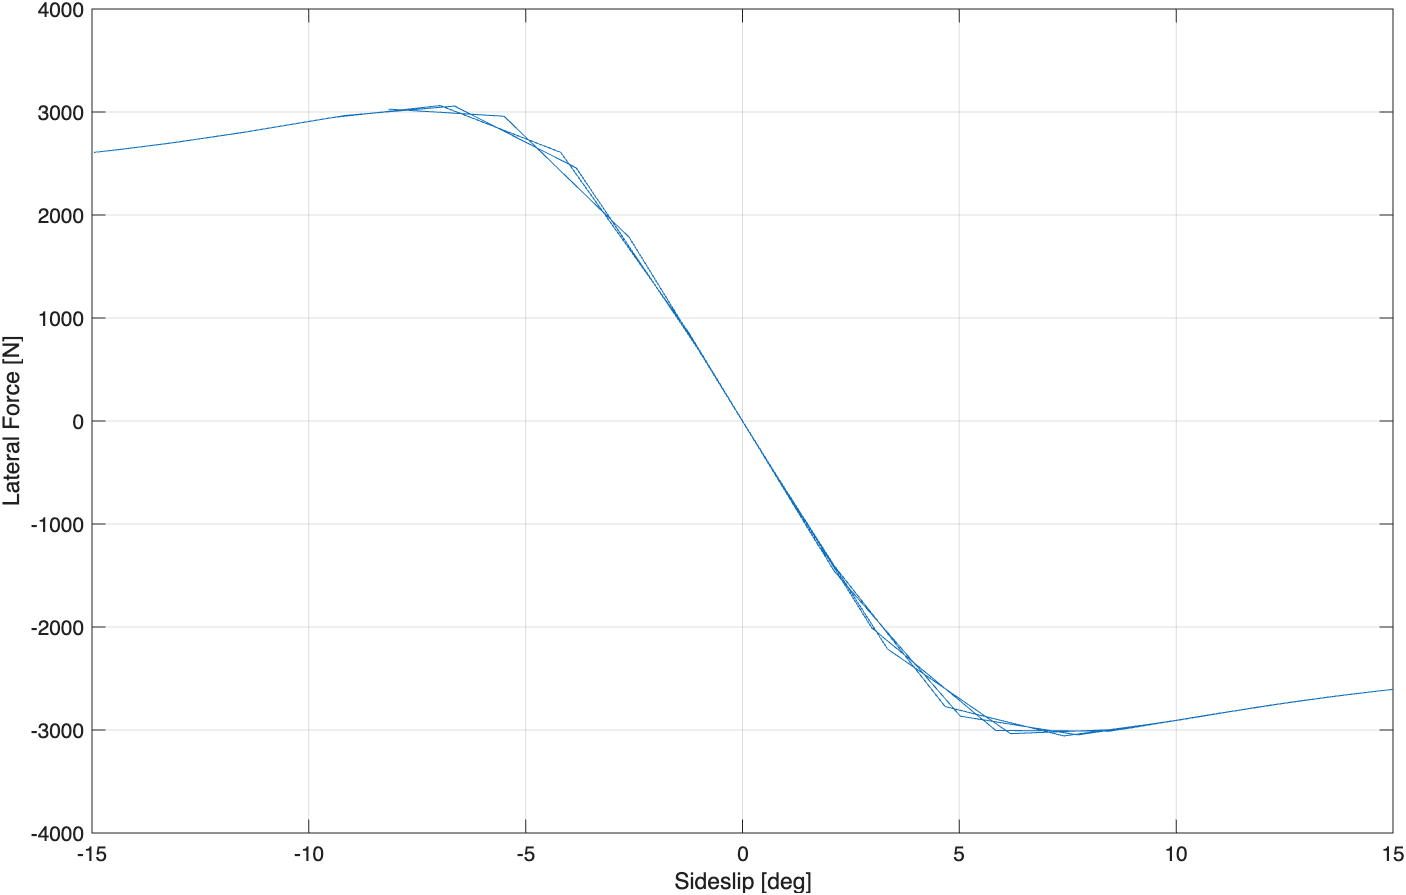
NUMERICAL DECISION
0.20 s → 0.01 s
Reducing the simulation step increased the resolution through the nonlinear peak-force region and removed visible discretisation in the force-slip response.
ENGINEERING INTERPRETATION
Around the zero-slip region, lateral force changes rapidly with sideslip and the response is approximately linear. As sideslip increases, the relationship becomes progressively nonlinear before reaching a peak-force region.
Beyond this point, additional sideslip no longer produces a proportional increase in lateral force. This behaviour is fundamental to the later vehicle models because a linear tyre approximation becomes less representative as the tyre approaches its force limit.
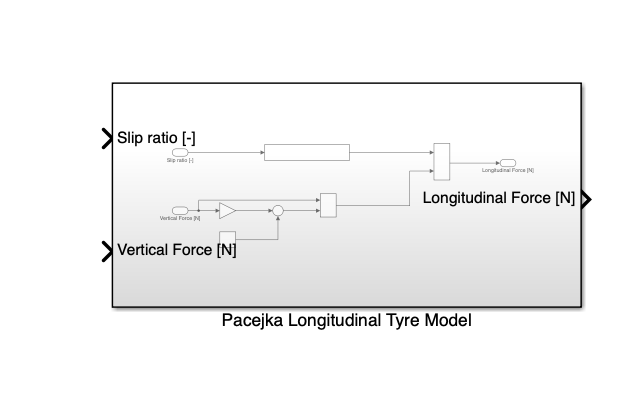
The same subsystem architecture was adapted for longitudinal tyre behaviour. Sideslip angle was replaced by longitudinal slip ratio, while the corresponding longitudinal Pacejka parameter set was loaded through the same parameterised workflow.
02
LATERAL VEHICLE DYNAMICS
HANDLING BALANCE · TYRE UTILISATION · TRANSIENT RESPONSE
How do the steady-state and transient lateral-dynamics characteristics of a Formula vehicle differ from those of a conventional road vehicle?
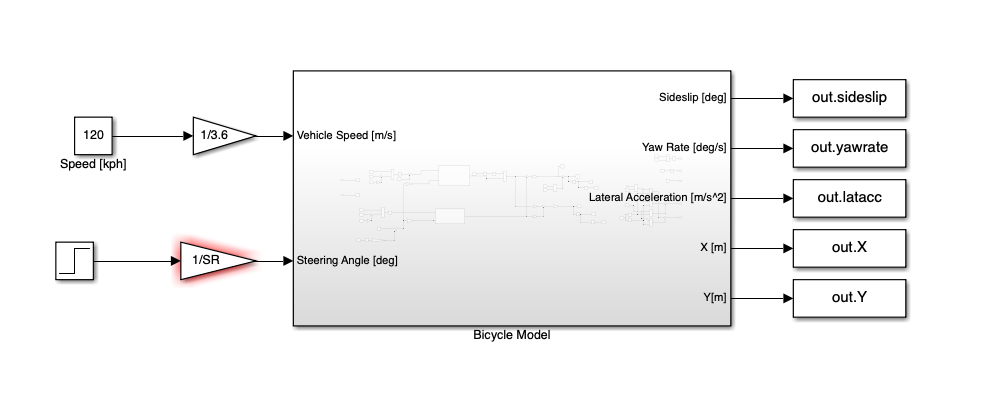
The bicycle model extends the previously developed tyre subsystem to a full vehicle representation. Front and rear axle vertical loads are calculated from vehicle mass distribution and aerodynamic load, then passed to independently parameterised front and rear Pacejka tyre models.
The subsystem returns vehicle sideslip, yaw rate, lateral acceleration and global position, enabling both steady-state and transient handling analysis.
STEADY-STATE
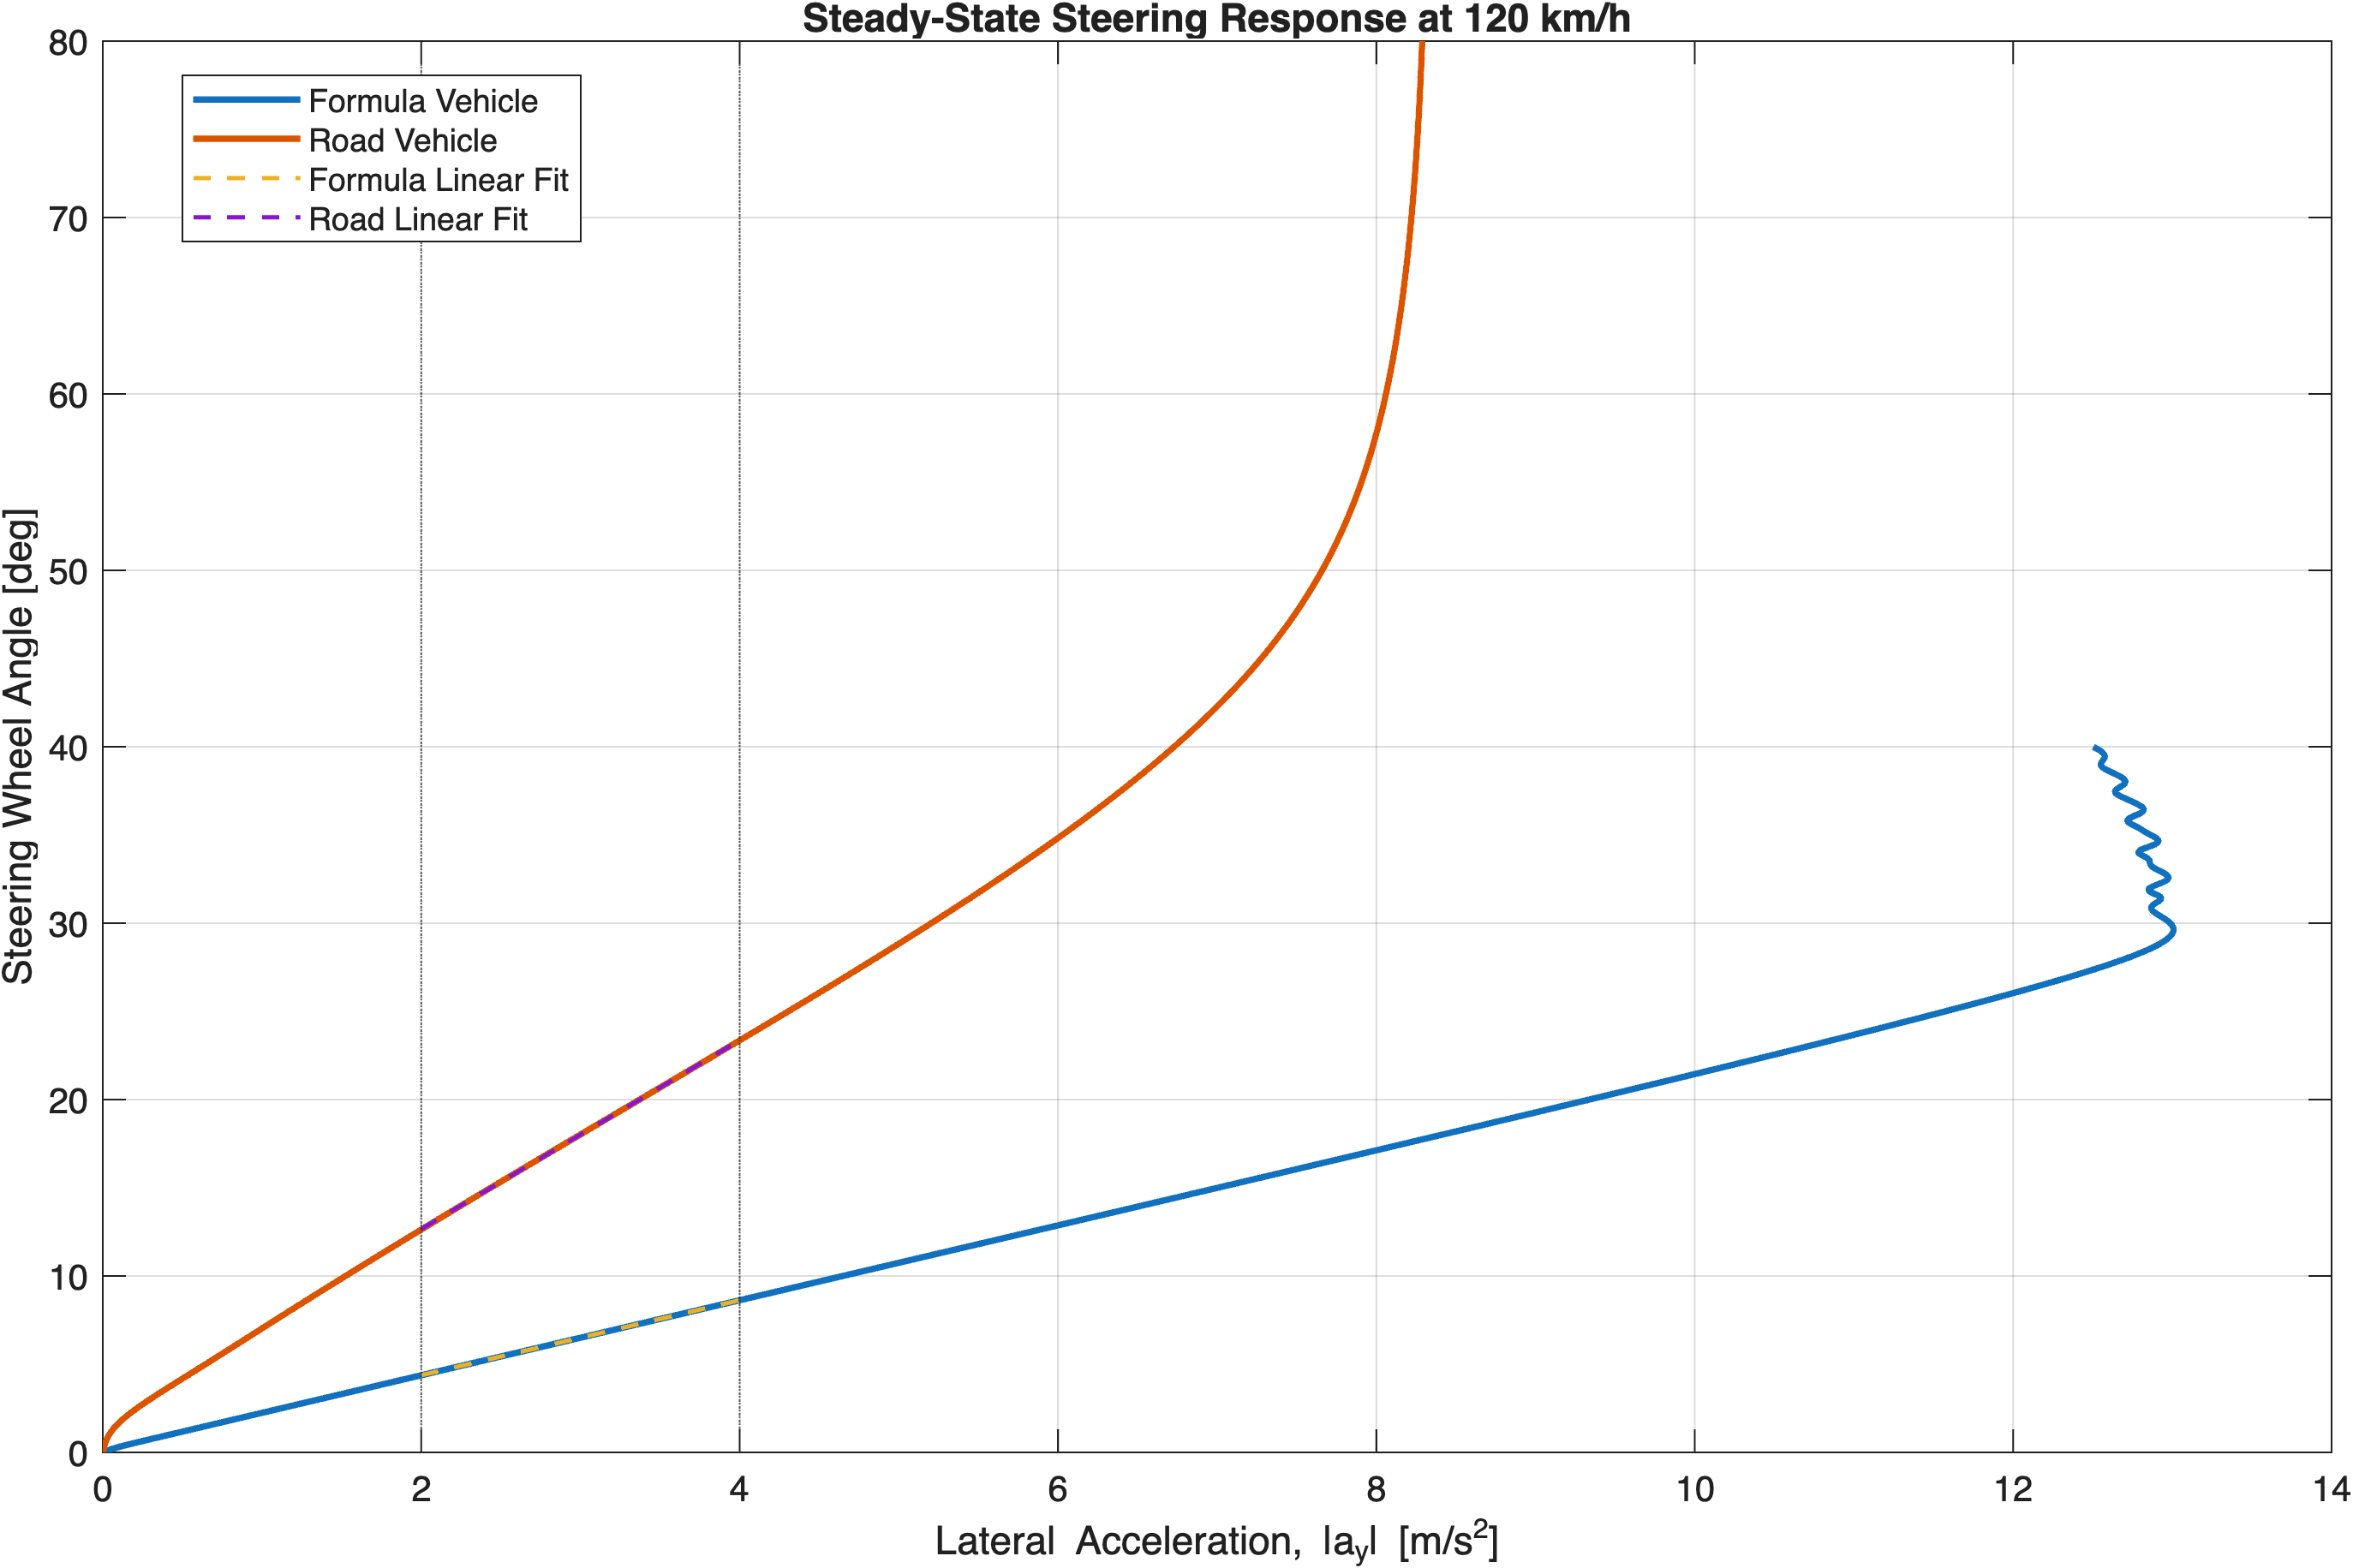
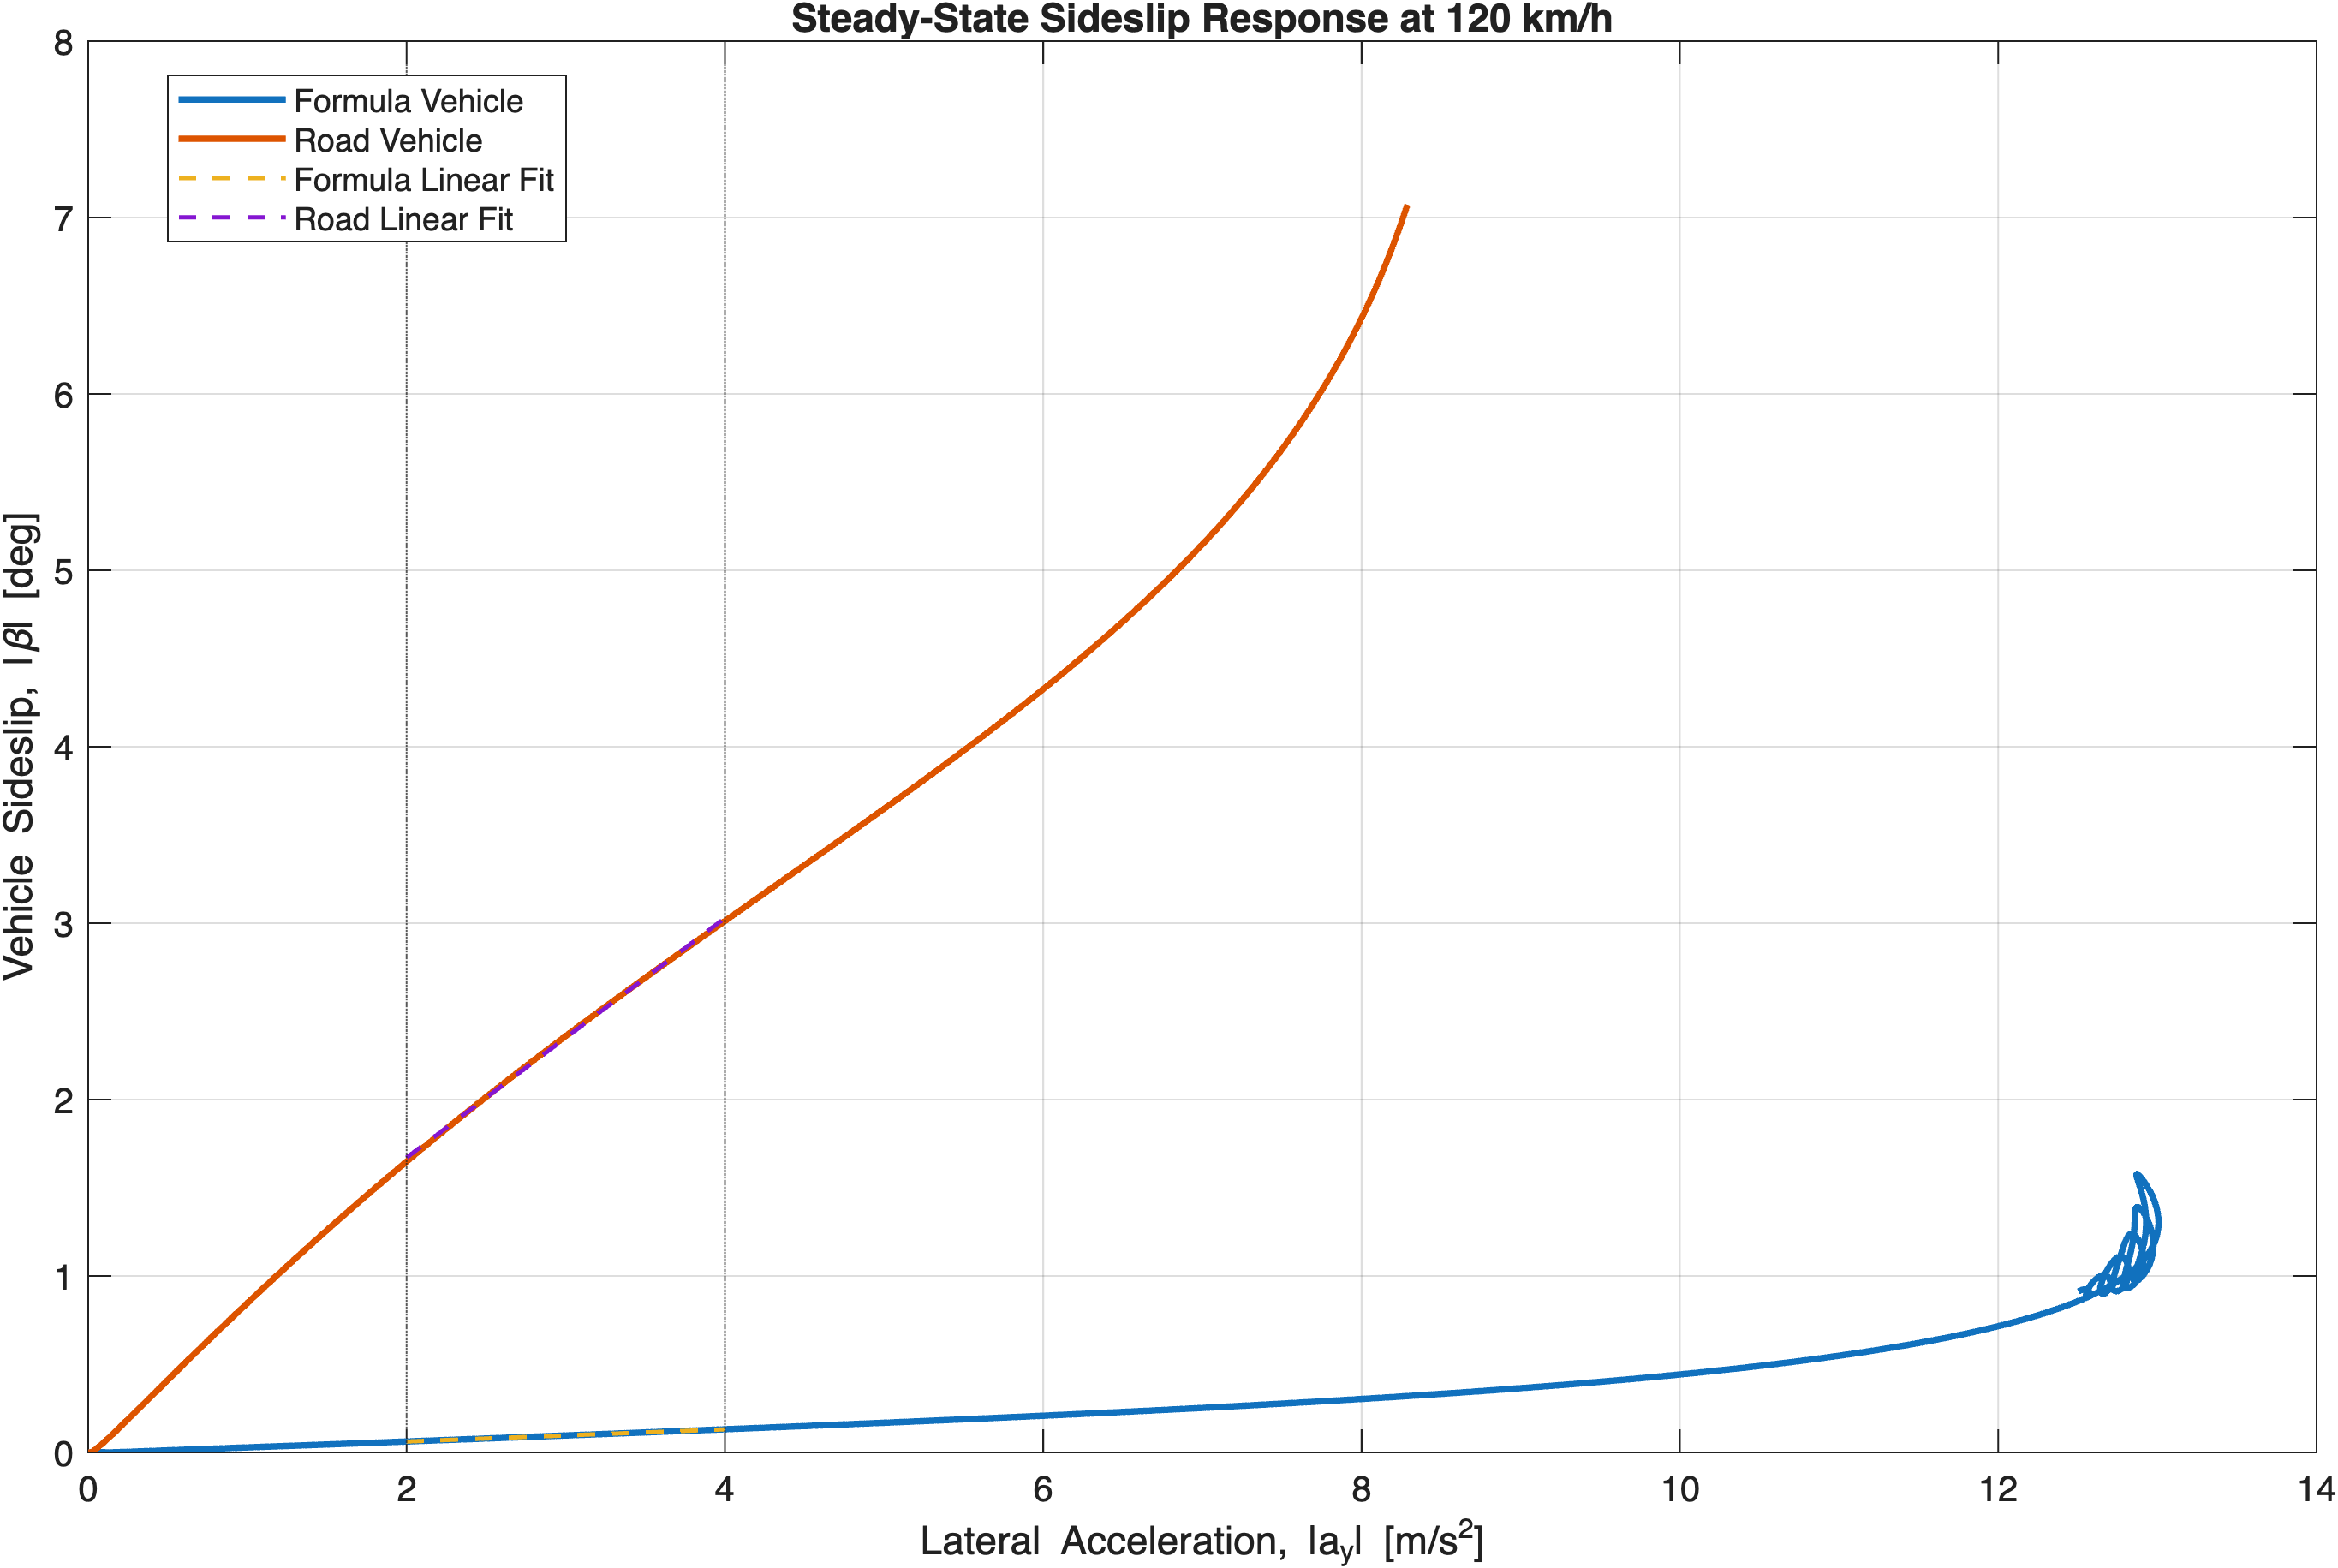
K US = (1 / SR)(∂SWA / ∂a y ) − (L / V²)(180 / π)
TYRE UTILISATION
The Formula vehicle generates considerably more lateral acceleration for a comparatively small increase in vehicle sideslip, while the road vehicle requires much greater sideslip as lateral demand rises.
Both responses become increasingly nonlinear as tyre utilisation rises, but the Formula configuration reaches substantially higher lateral acceleration before strong nonlinear behaviour becomes dominant.
TRANSIENT
ENGINEERING INTERPRETATION
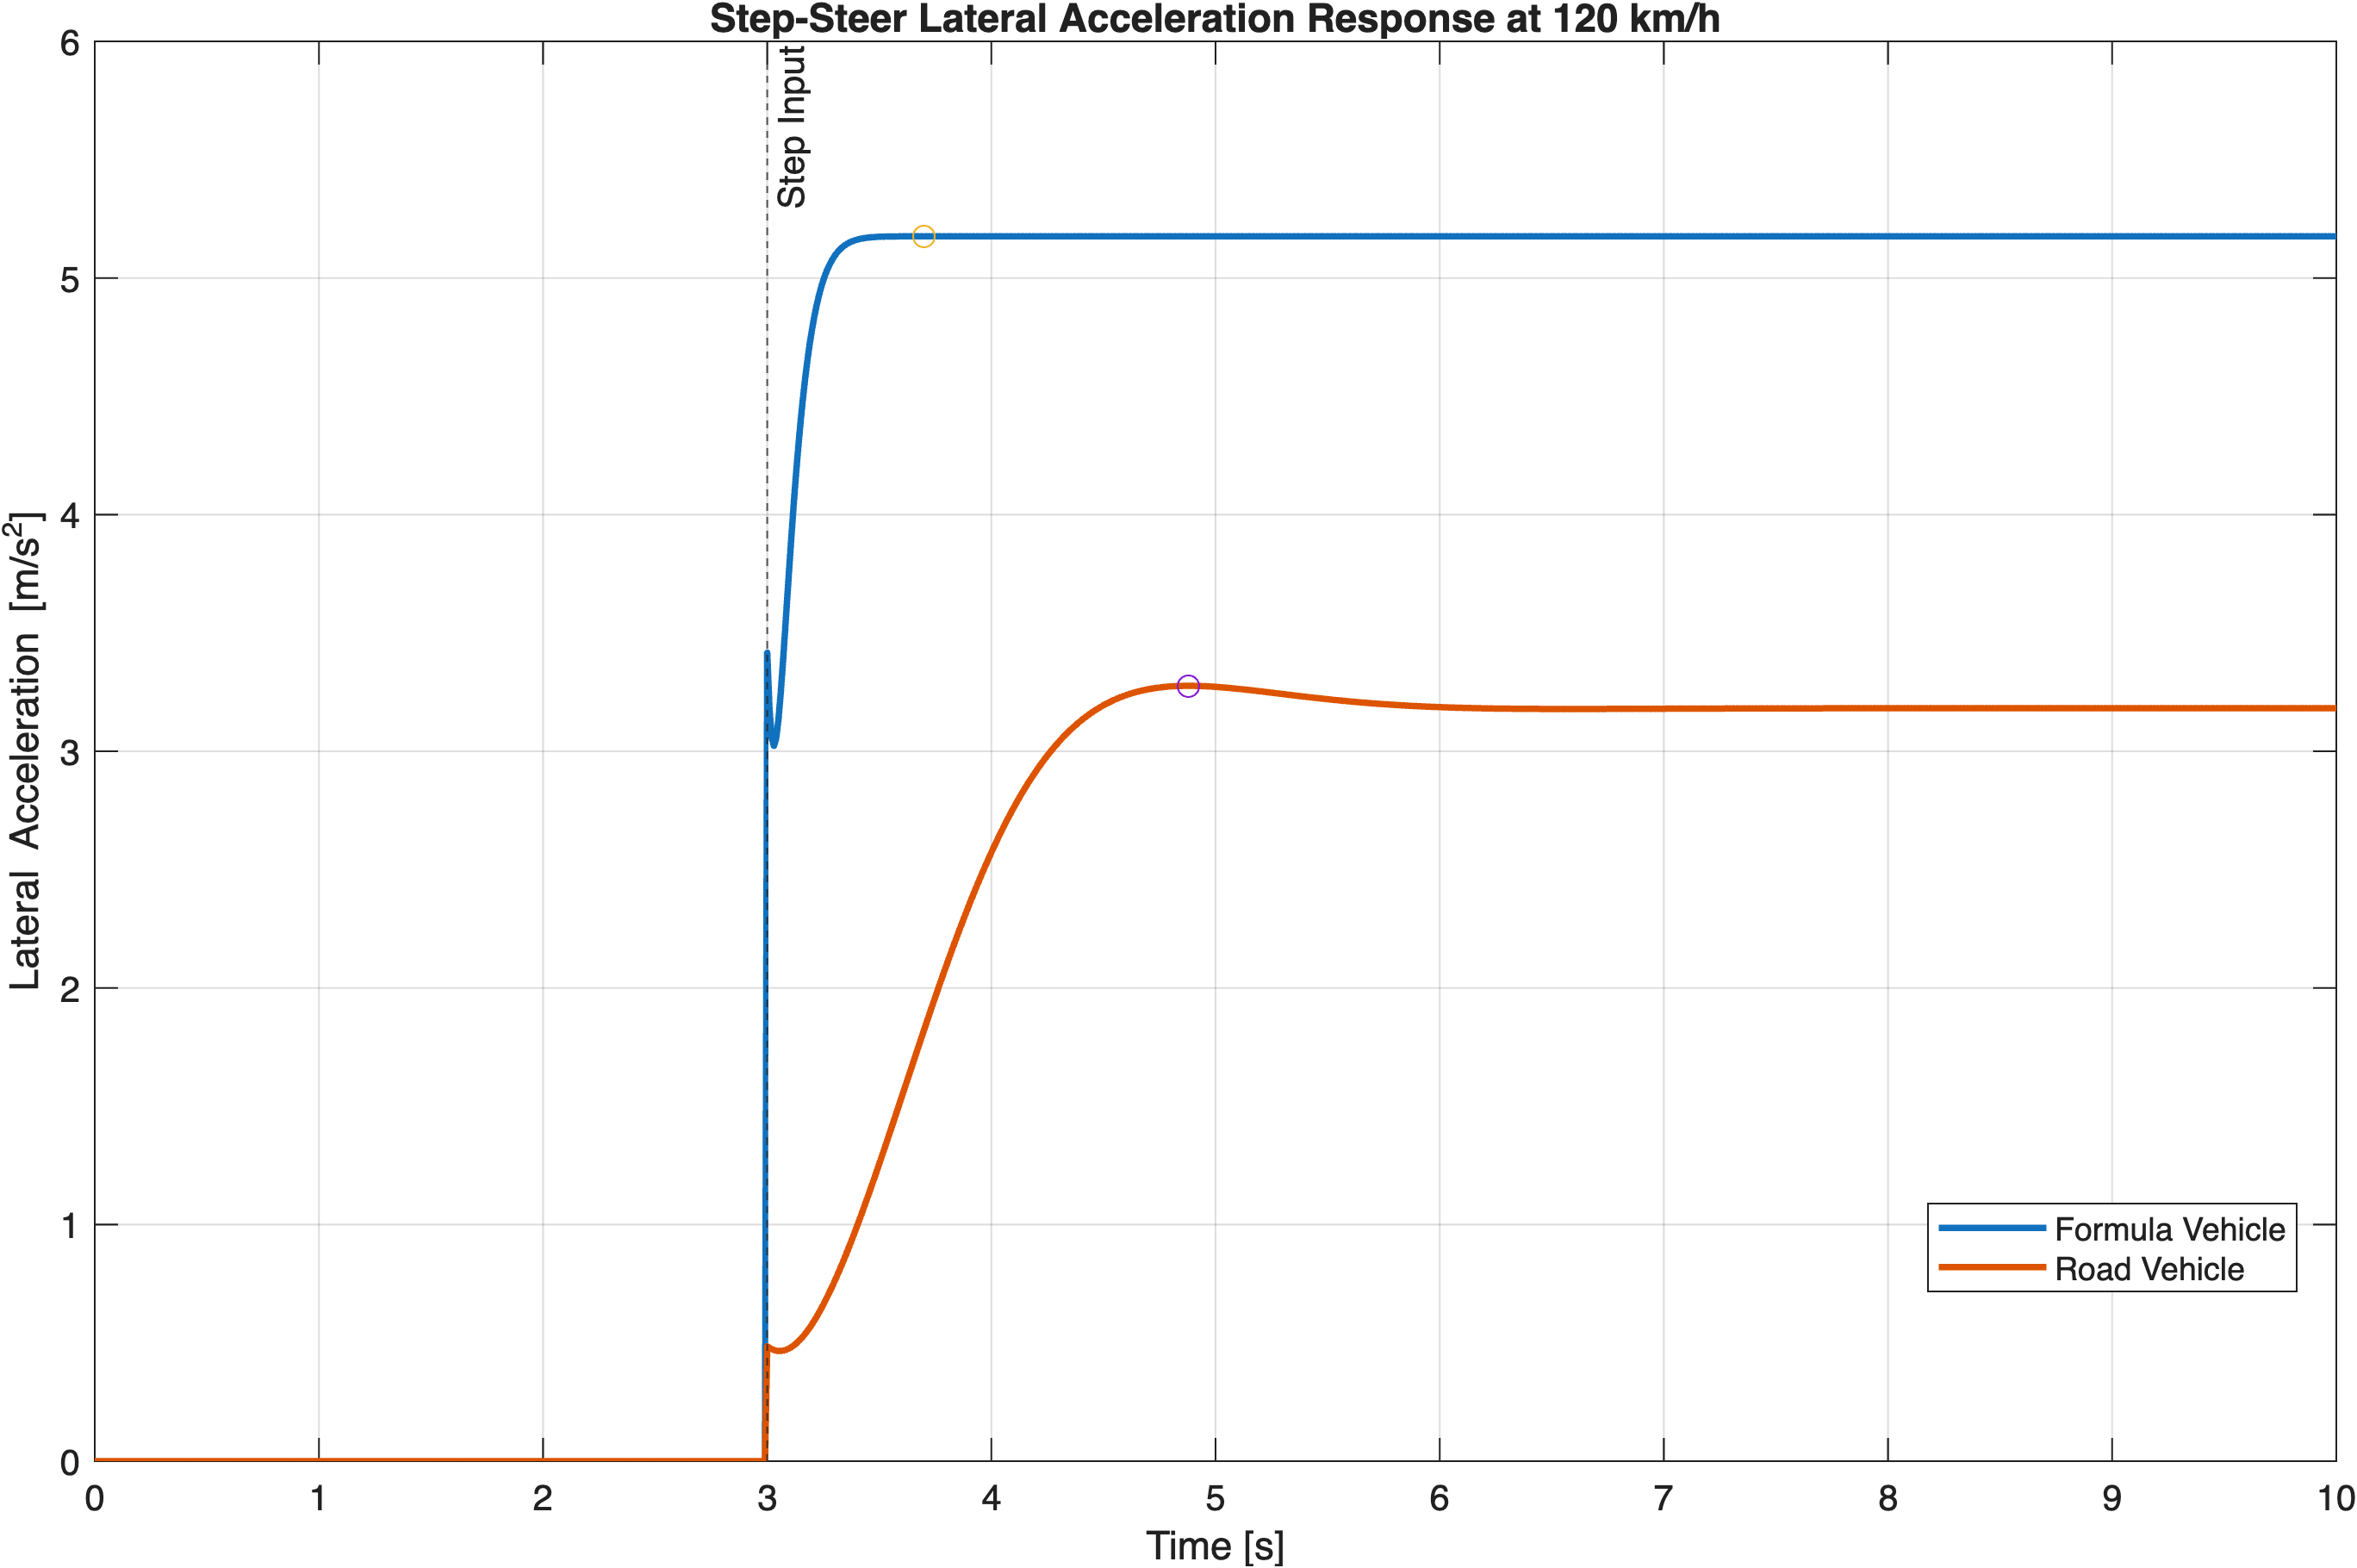
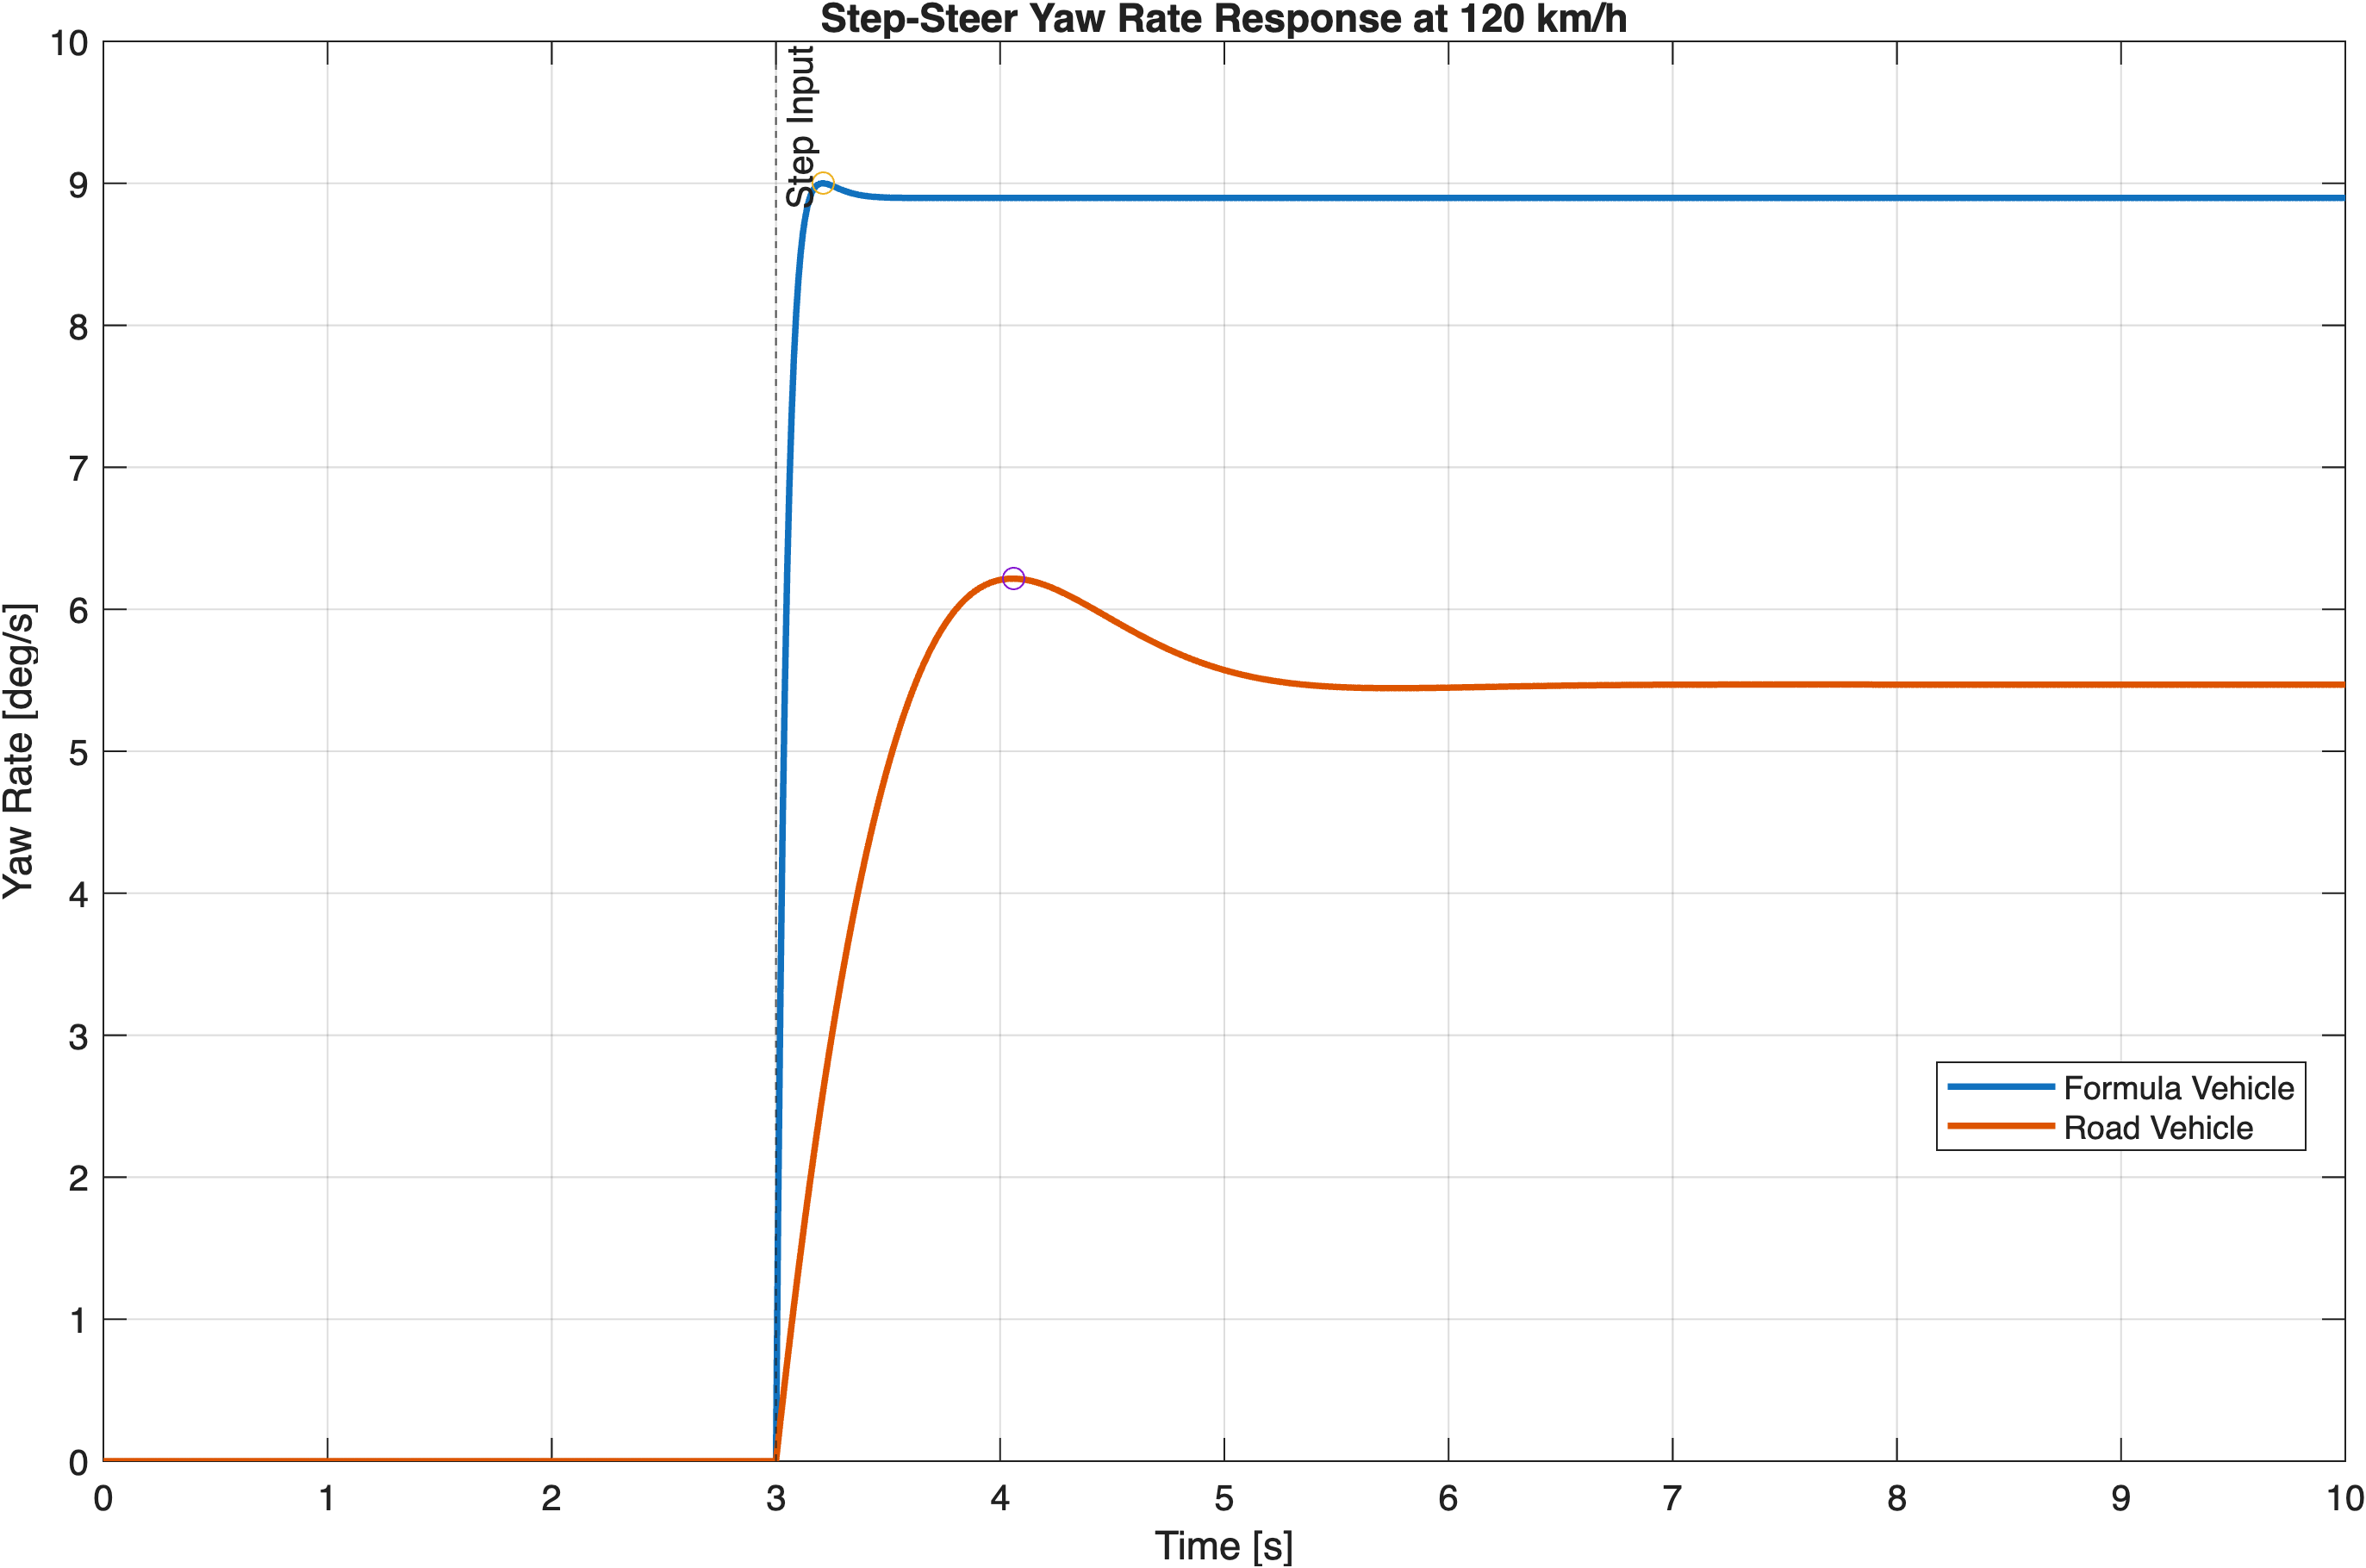
The Formula configuration combines lower mass and yaw inertia, greater tyre lateral-force capability, lower steering ratio and aerodynamic downforce. The result is a higher steering response, milder understeer, reduced sideslip and substantially faster transient behaviour.
03
LONGITUDINAL VEHICLE DYNAMICS
BRAKE BALANCE · TYRE SLIP · AERODYNAMIC LOAD
How do brake balance, tyre longitudinal capacity and aerodynamic loading interact to determine braking performance?
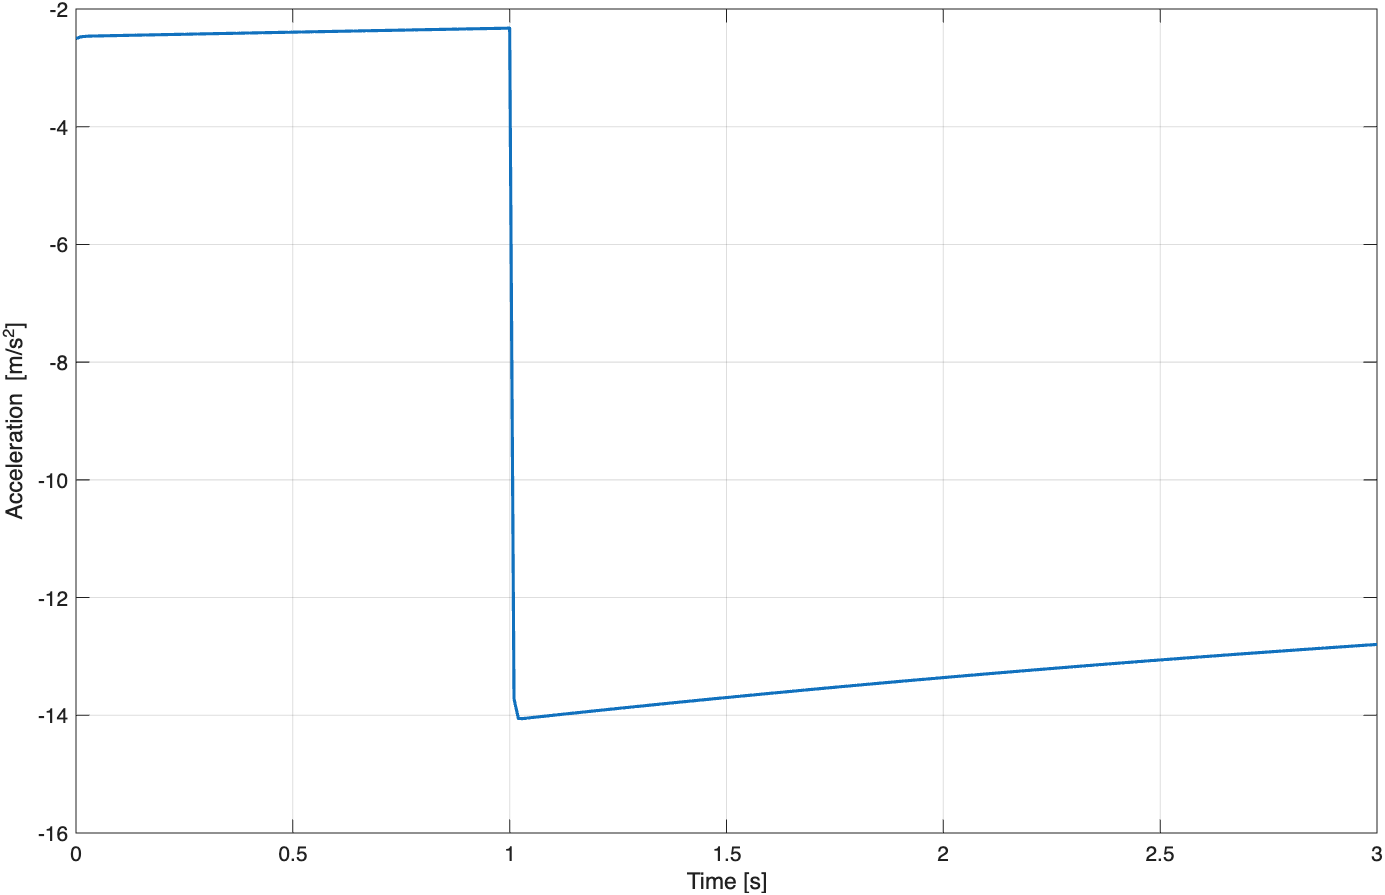
The longitudinal Pacejka force output is sign-corrected so that tyre force acts opposite the vehicle direction during braking. Wheel rotational speed is also initialised consistently with vehicle speed so that the simulation begins close to a free-rolling condition rather than with an artificial high-slip transient.
Vehicle speed → wheel speed → near-zero initial slip → brake application
SYSTEM VERIFICATION
TYRE UTILISATION
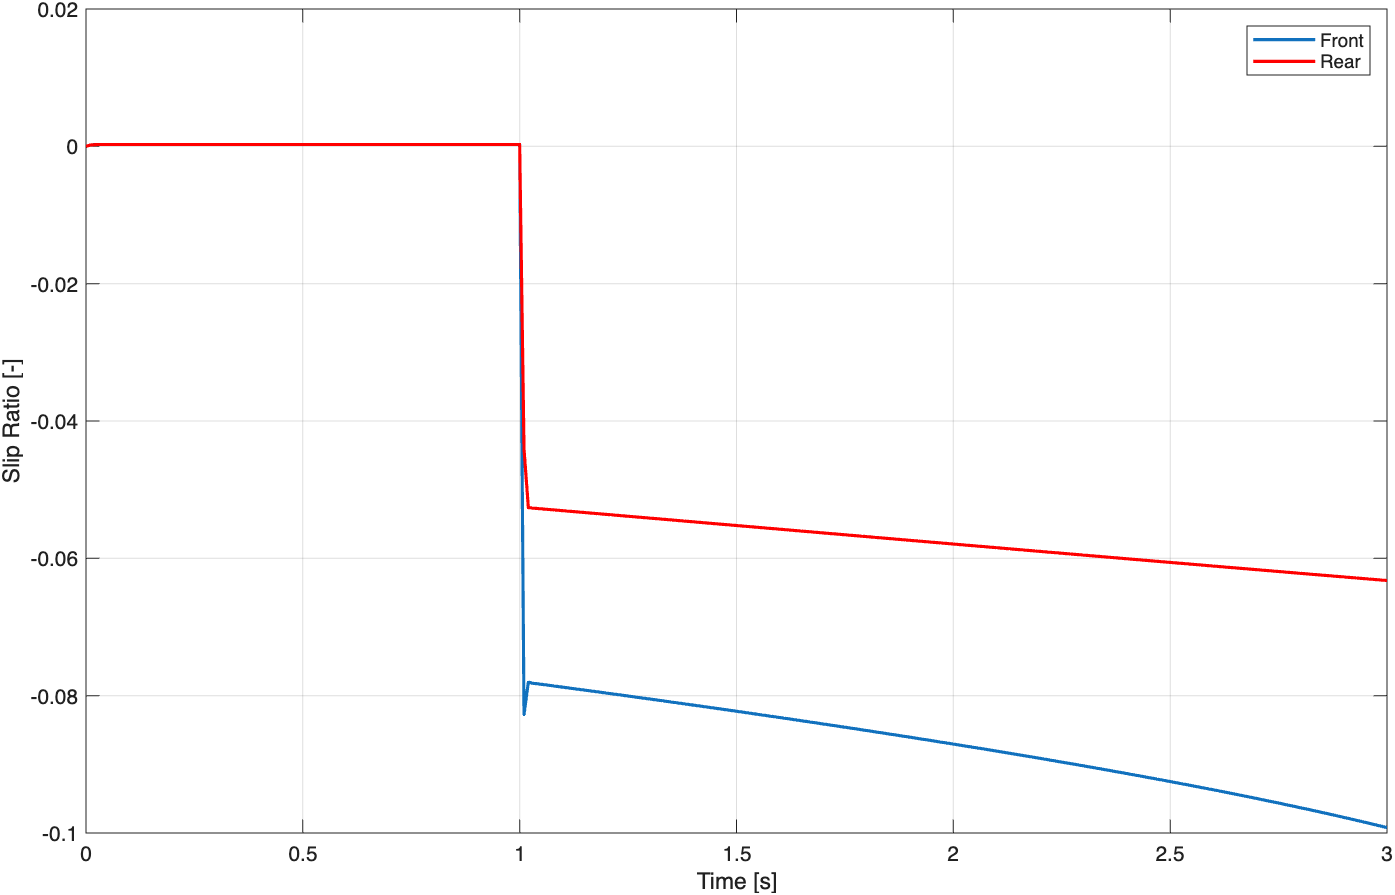
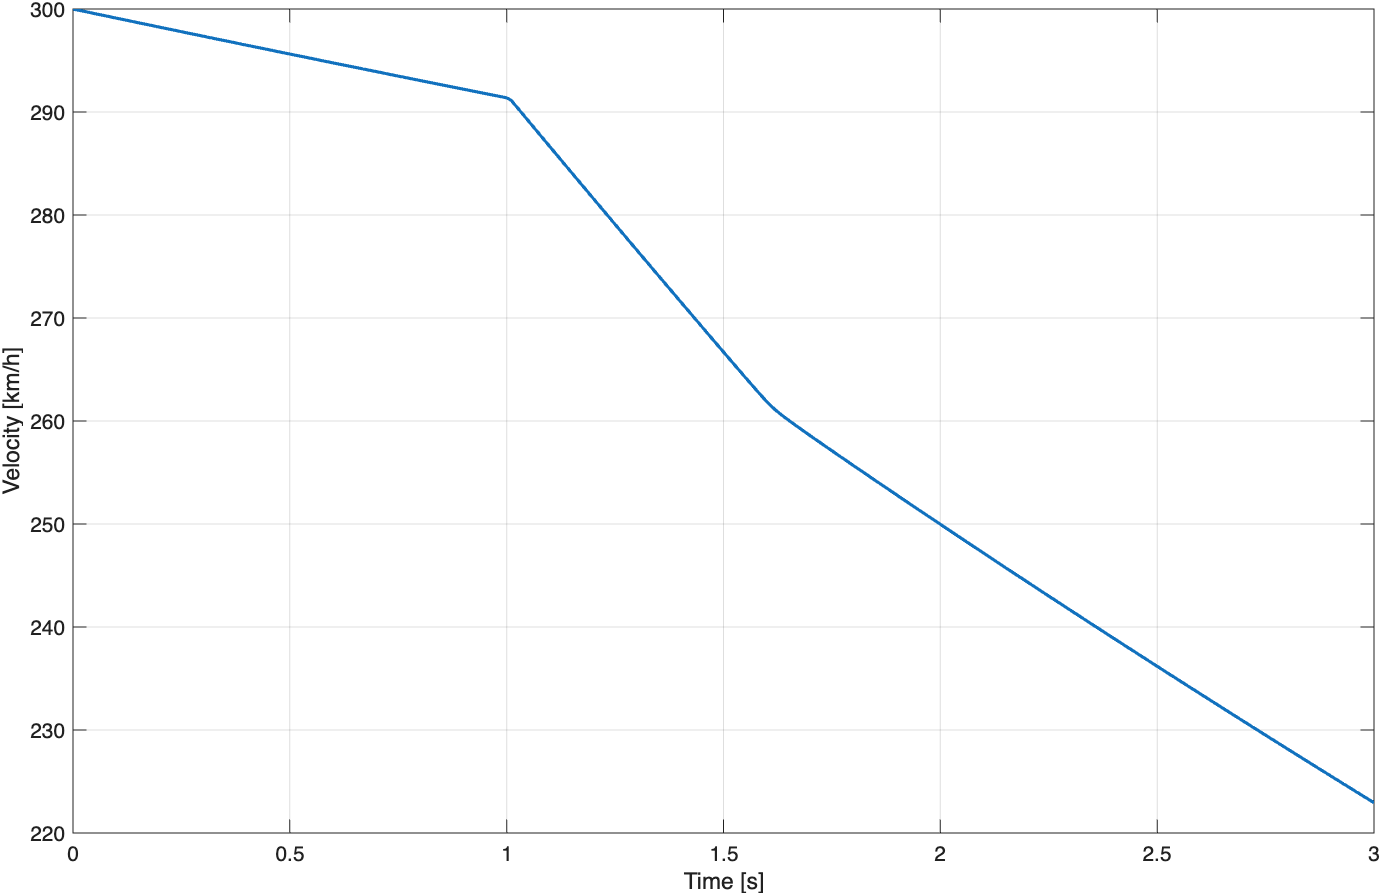
Before brake application the tyres are close to free rolling. Once braking begins, both axles develop longitudinal slip. The front axle operates at greater slip magnitude because the baseline brake balance directs a larger proportion of brake torque to the front.
SENSITIVITY STUDY
PERFORMANCE INSIGHT
MORE BRAKE DEMAND ≠ MORE BRAKING PERFORMANCE
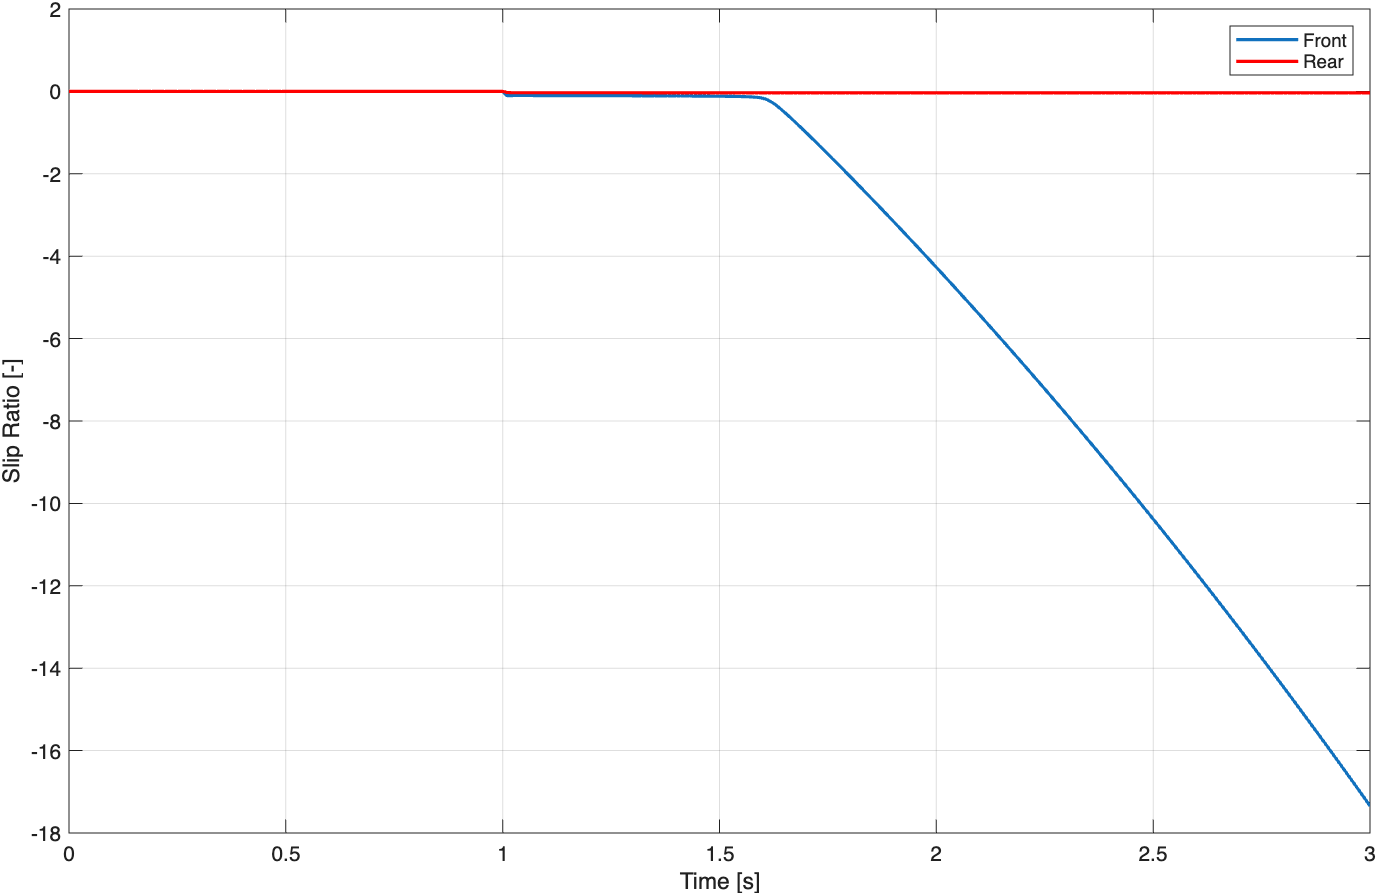
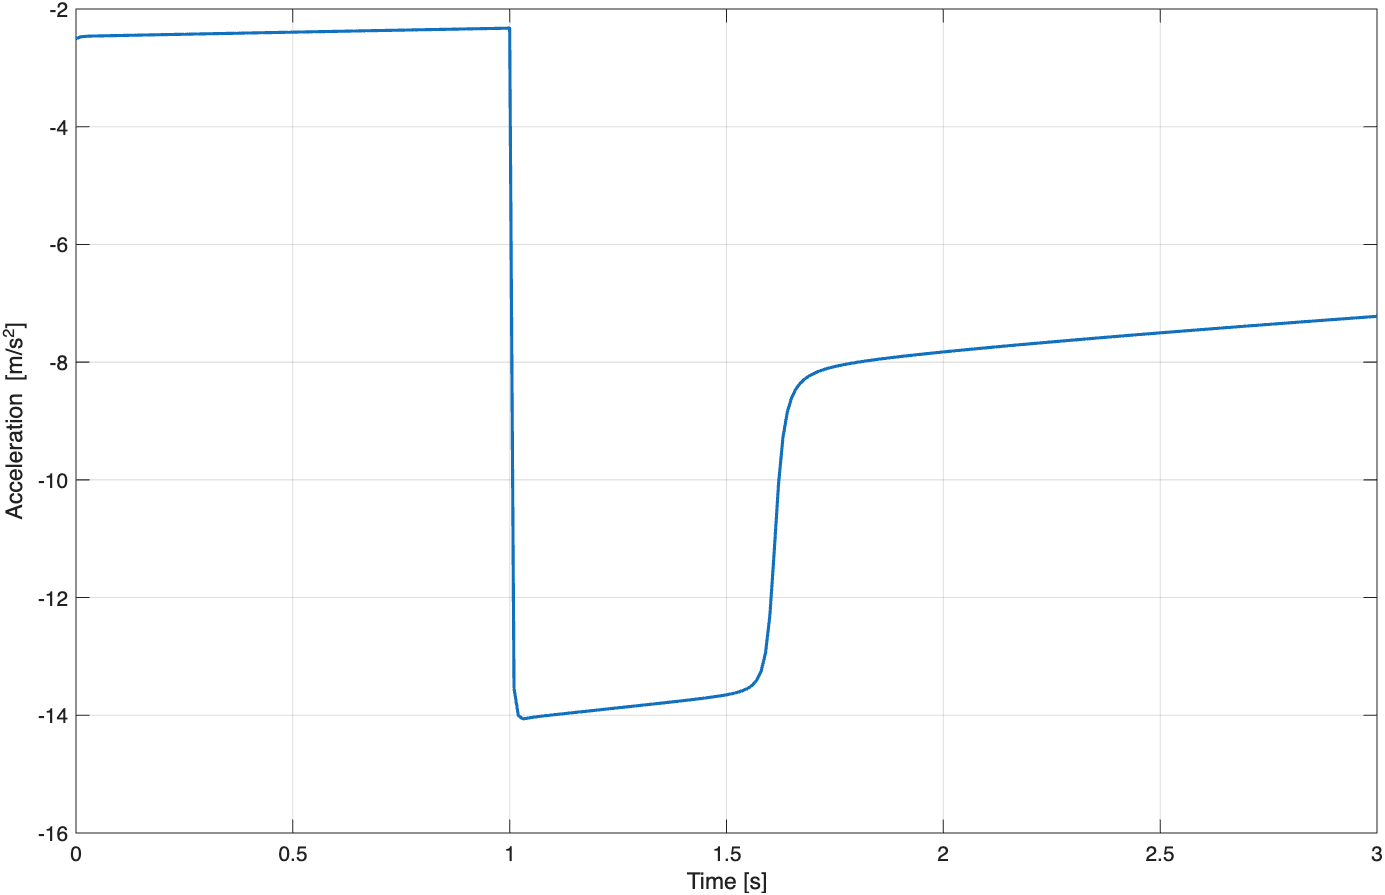
Increasing front bias beyond the available front-tyre capacity drives the front axle towards excessive slip while the rear axle remains comparatively under-utilised. Brake distribution therefore needs to reflect the usable tyre capacity at each axle.
PERFORMANCE CASE STUDY
AERODYNAMIC SENSITIVITY
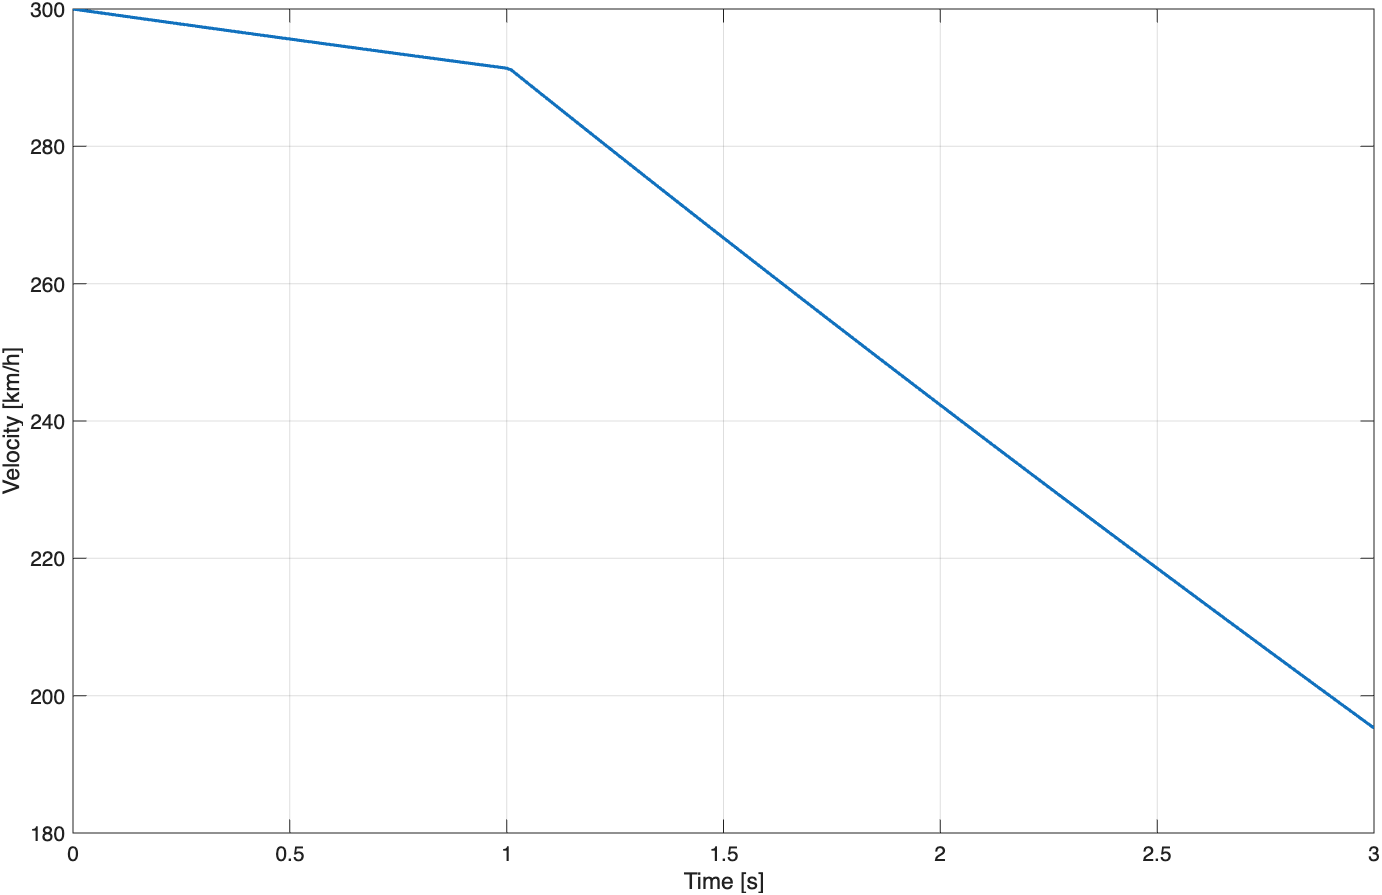
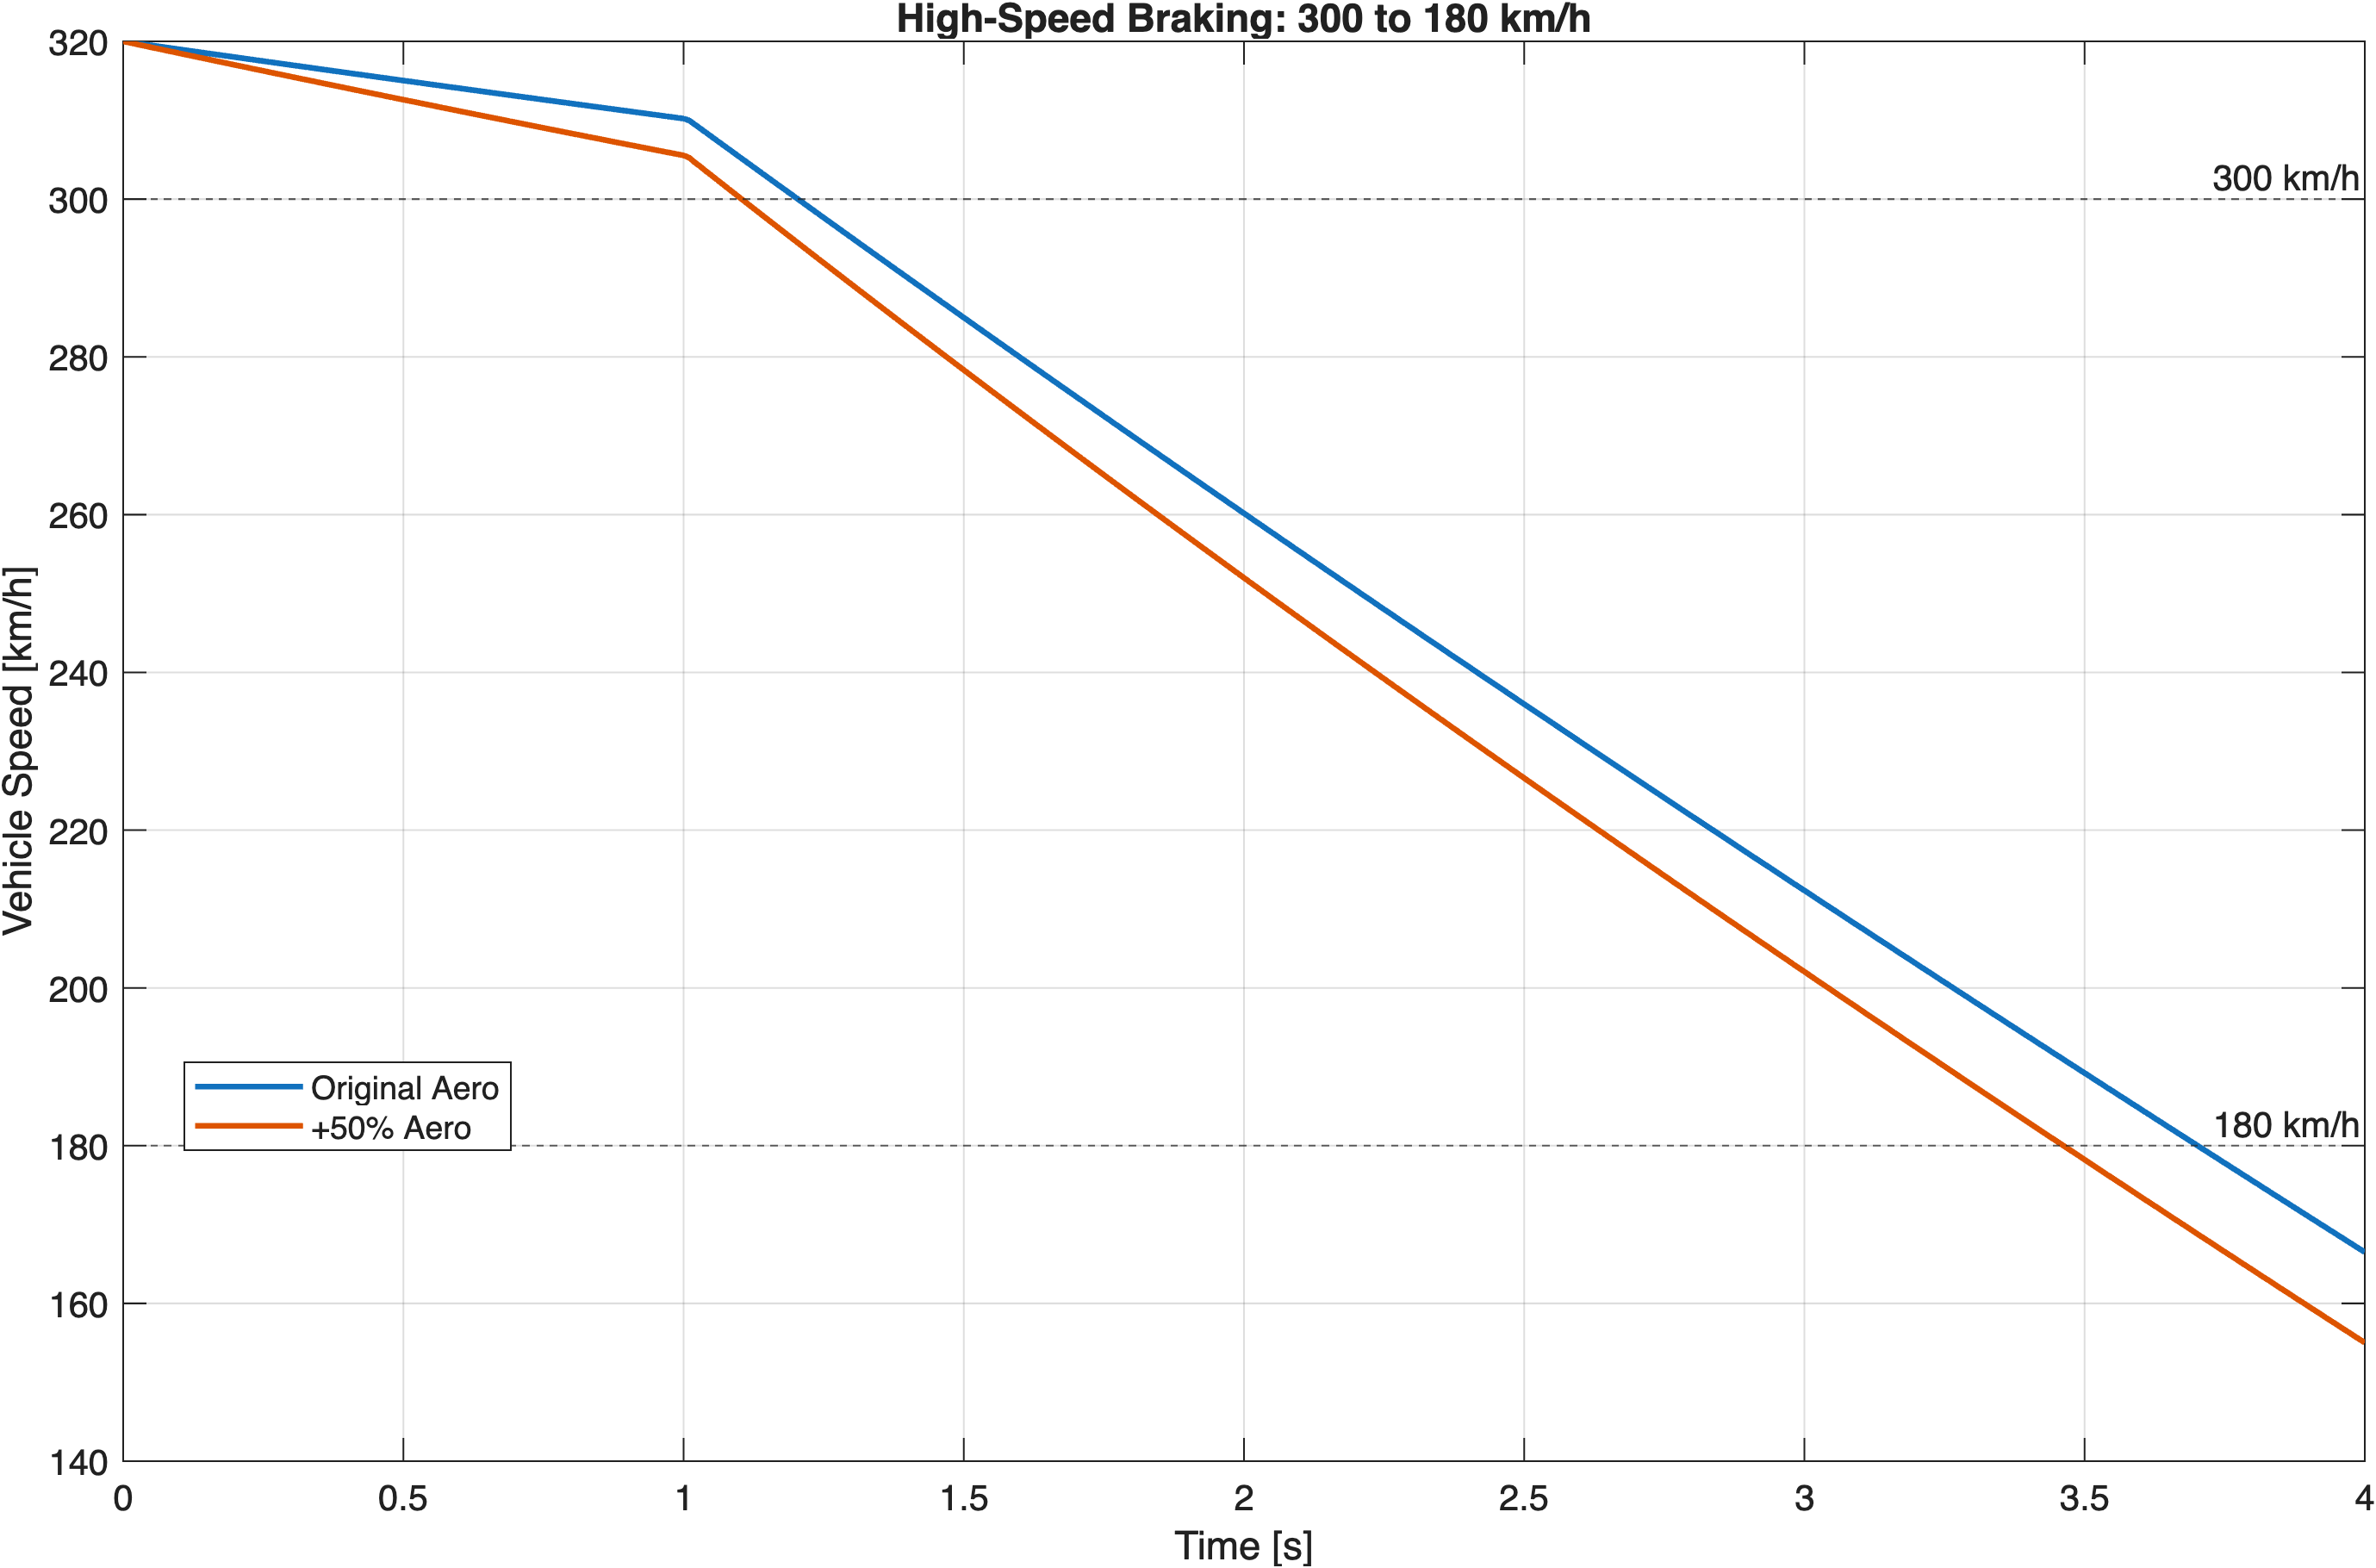
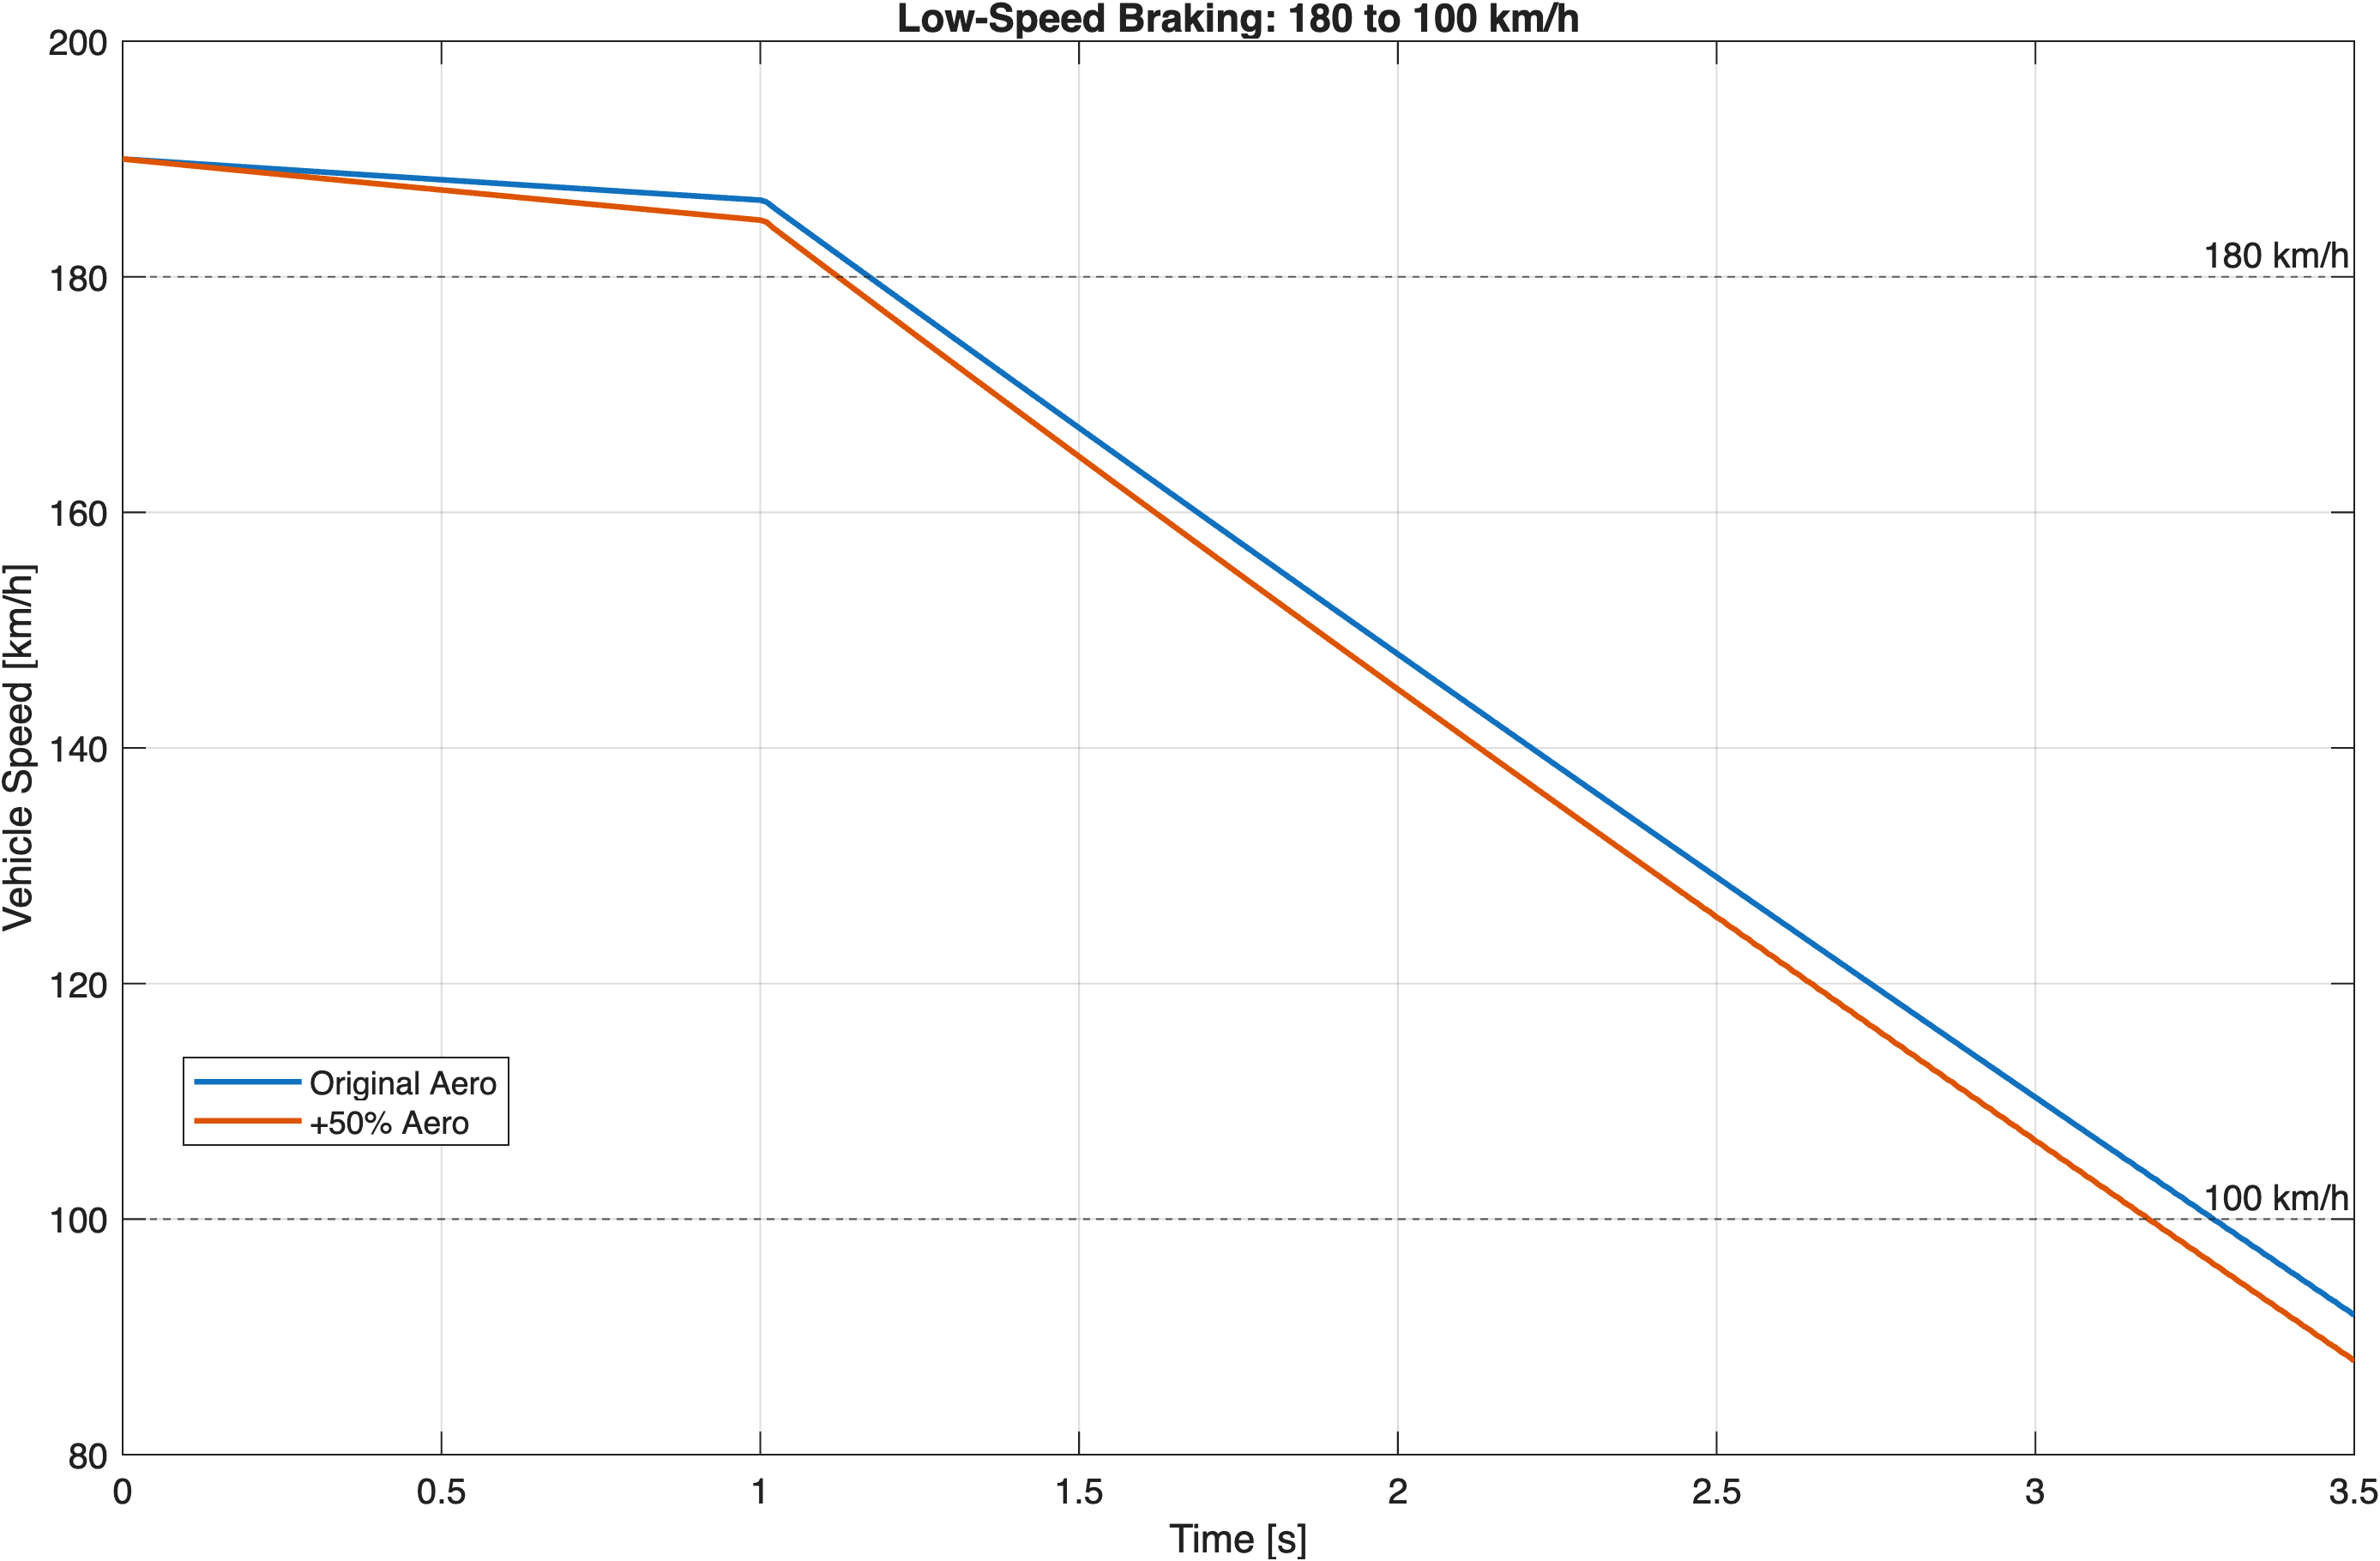
The braking model was used to investigate how aerodynamic loading changes stopping performance across two speed windows. The baseline configuration used C d = 0.40 and C z = 1.00 . Both coefficients were then increased by 50% to C d = 0.60 and C z = 1.50 .
Four simulations were run: baseline and increased-aero cases for 300–180 km/h and 180–100 km/h braking events. Braking time was calculated from the actual speed-crossing times rather than from the start of the simulation.
F DF = ½ρAC z V²
F D = ½ρAC d V²
HIGH-SPEED EVENT
LOWER-SPEED EVENT
time saved from 300–180 km/h
time saved from 180–100 km/h
300 km/h vs 180 km/h
ENGINEERING INTERPRETATION
AERODYNAMICS MATTERS MOST AT HIGH SPEED
Increasing downforce raises tyre normal load and therefore the available longitudinal tyre force, while increasing drag adds a direct decelerating force. Because both aerodynamic effects scale with V², the benefit is much greater in the 300–180 km/h window than in the 180–100 km/h window.
Both C d and C z were increased together in this study, so the measured improvement represents their combined effect rather than isolating drag and downforce individually.
04
LONGITUDINAL VEHICLE DYNAMICS
ENGINE MAP · GEARSHIFT LOGIC · ACCELERATION
How can engine characteristics, gearing, tyre force and aerodynamic resistance be combined to simulate full-throttle acceleration through multiple gears?
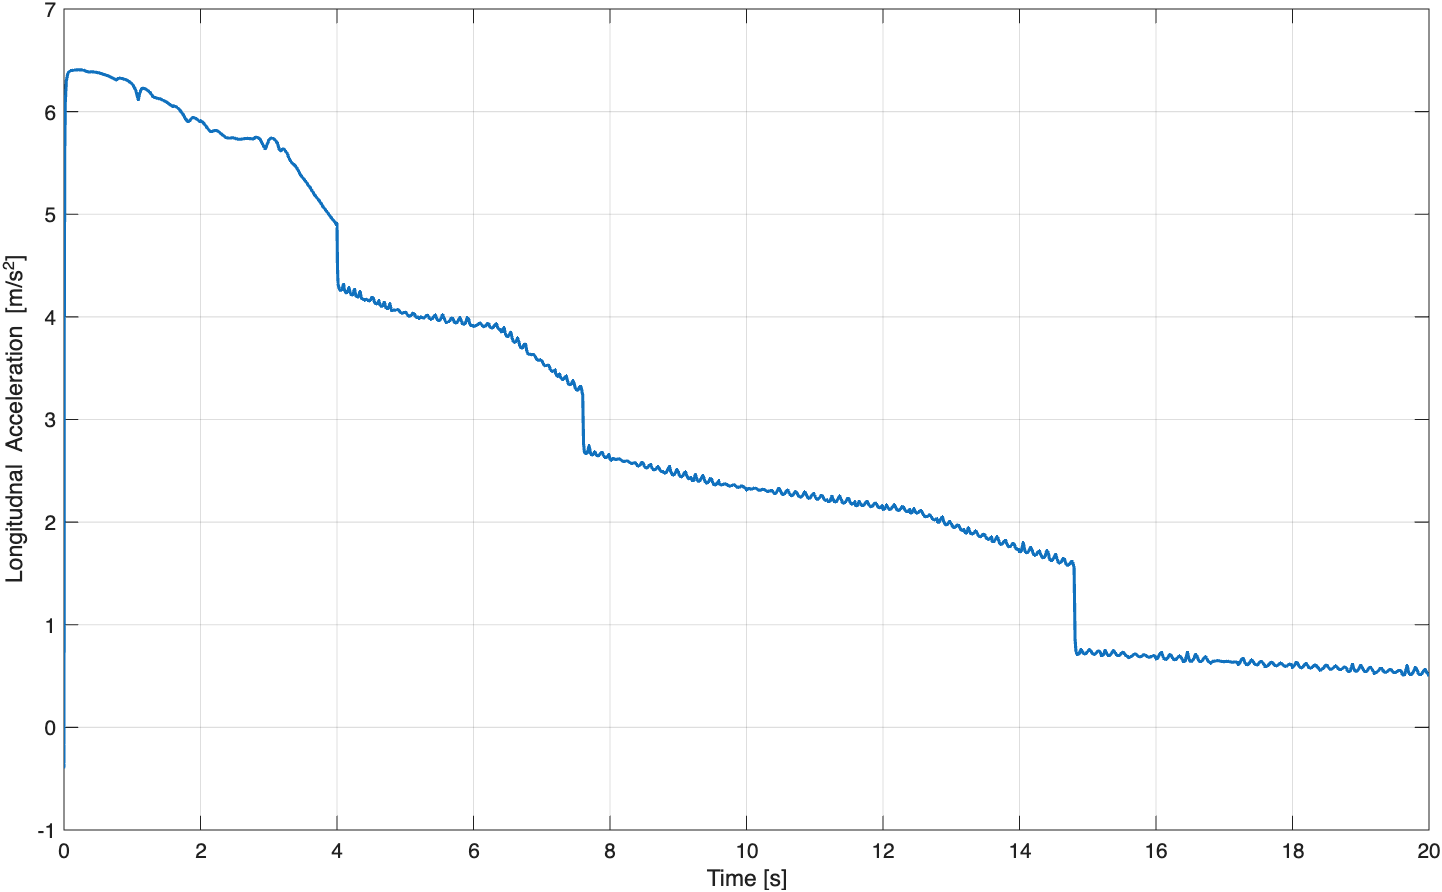
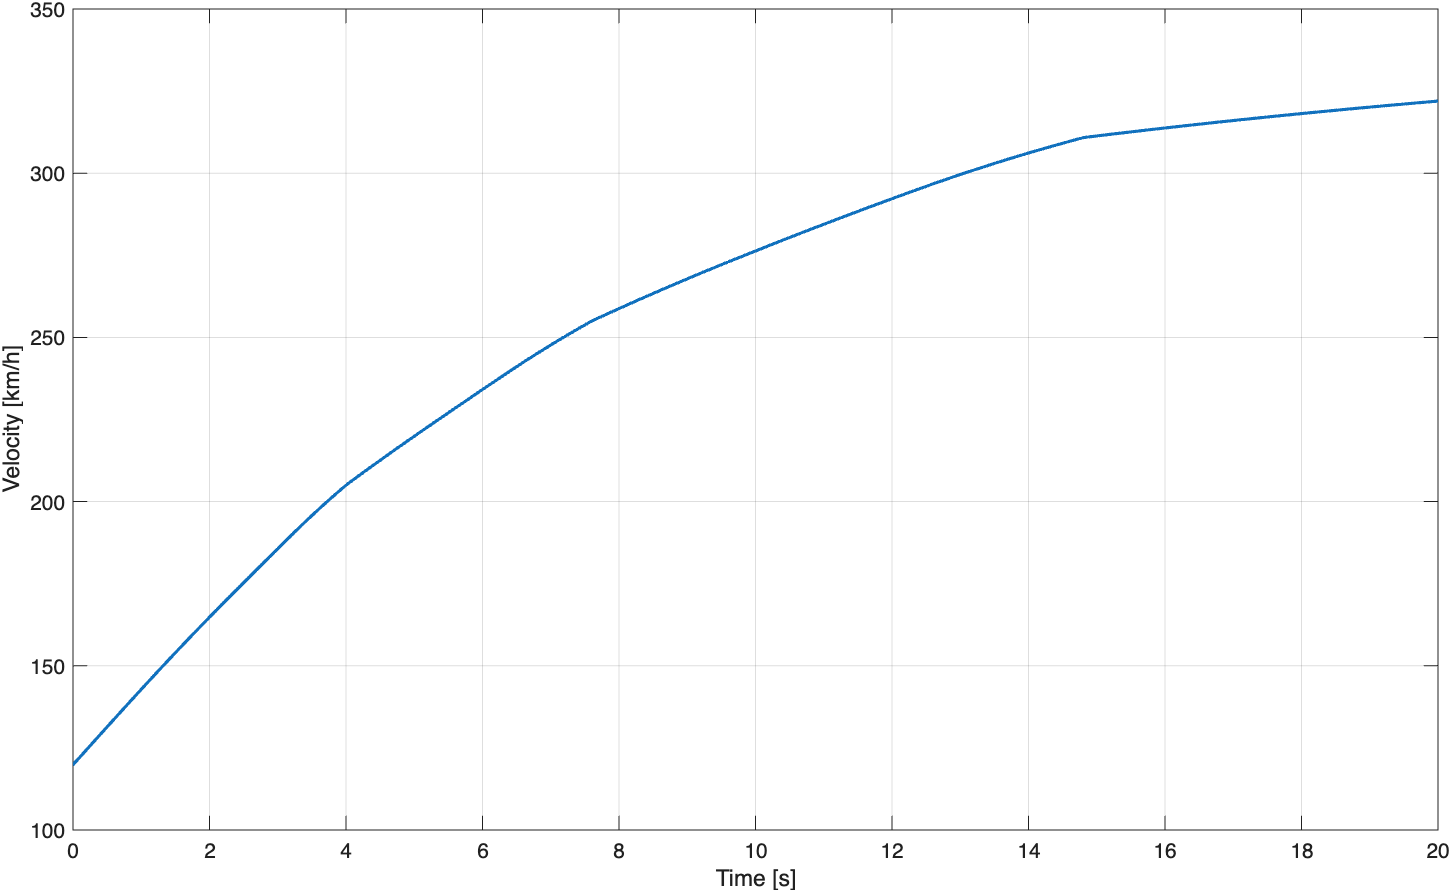
The model combines a throttle input, engine torque map, gear-ratio lookup, automatic upshift logic, longitudinal tyre-force model and vehicle dynamics. Outputs include acceleration, speed, distance, engine speed, selected gear and rear slip ratio.
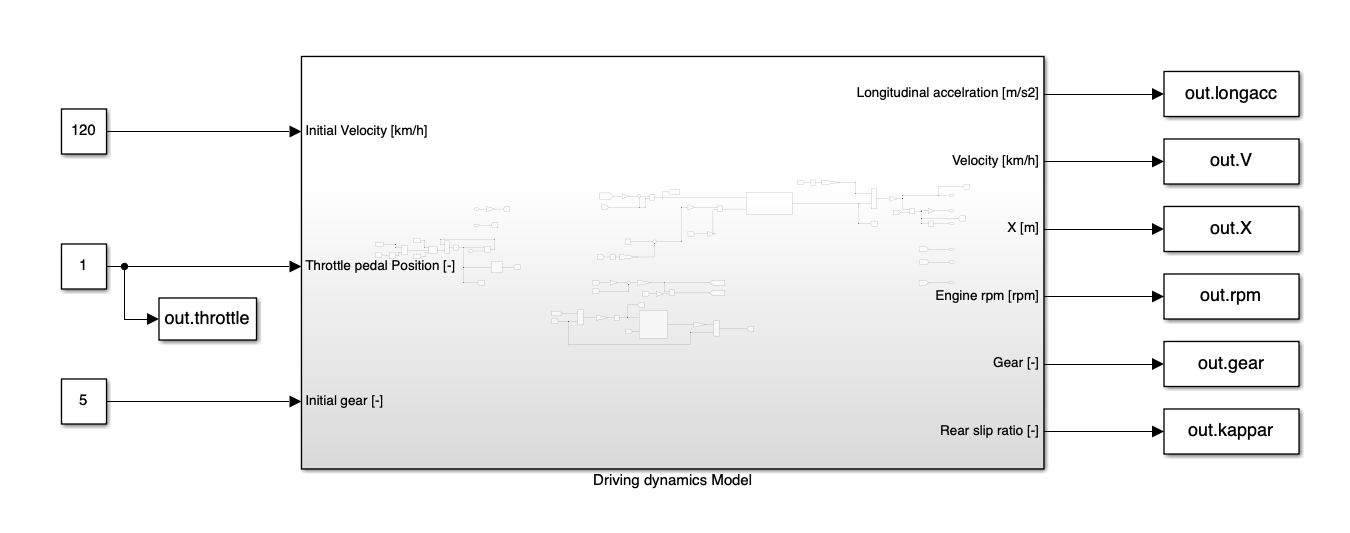
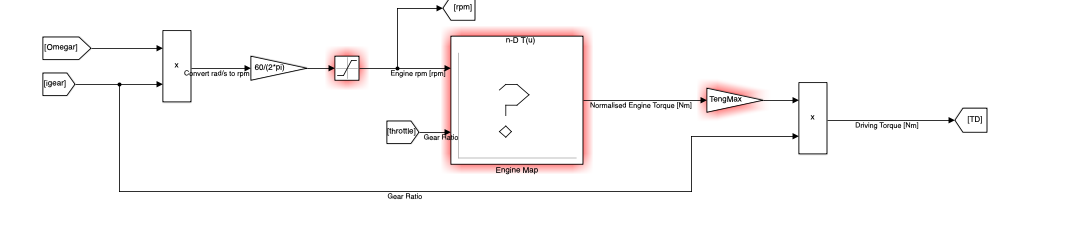
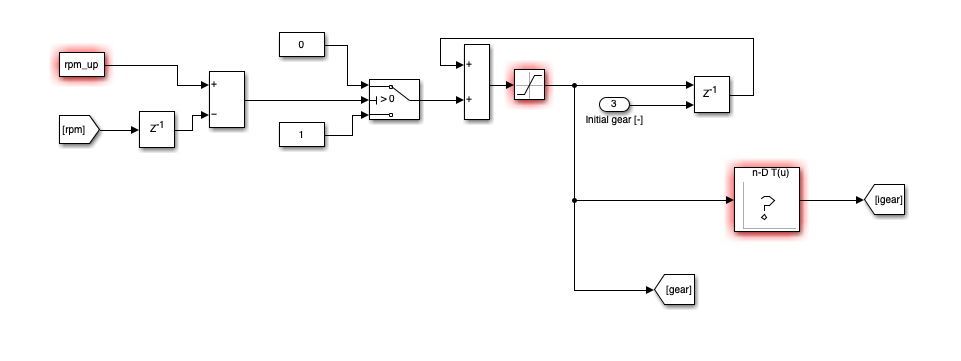
Engine speed is compared with an upshift threshold. Below the threshold, the existing gear is retained; above the threshold, the gear command increments by one.
A discrete delay is used in the gear-state feedback path to prevent an algebraic loop, while saturation constrains the selected gear to the physical 1–8 range.
HOLD CURRENT GEAR
GEAR + 1
SYSTEM VERIFICATION
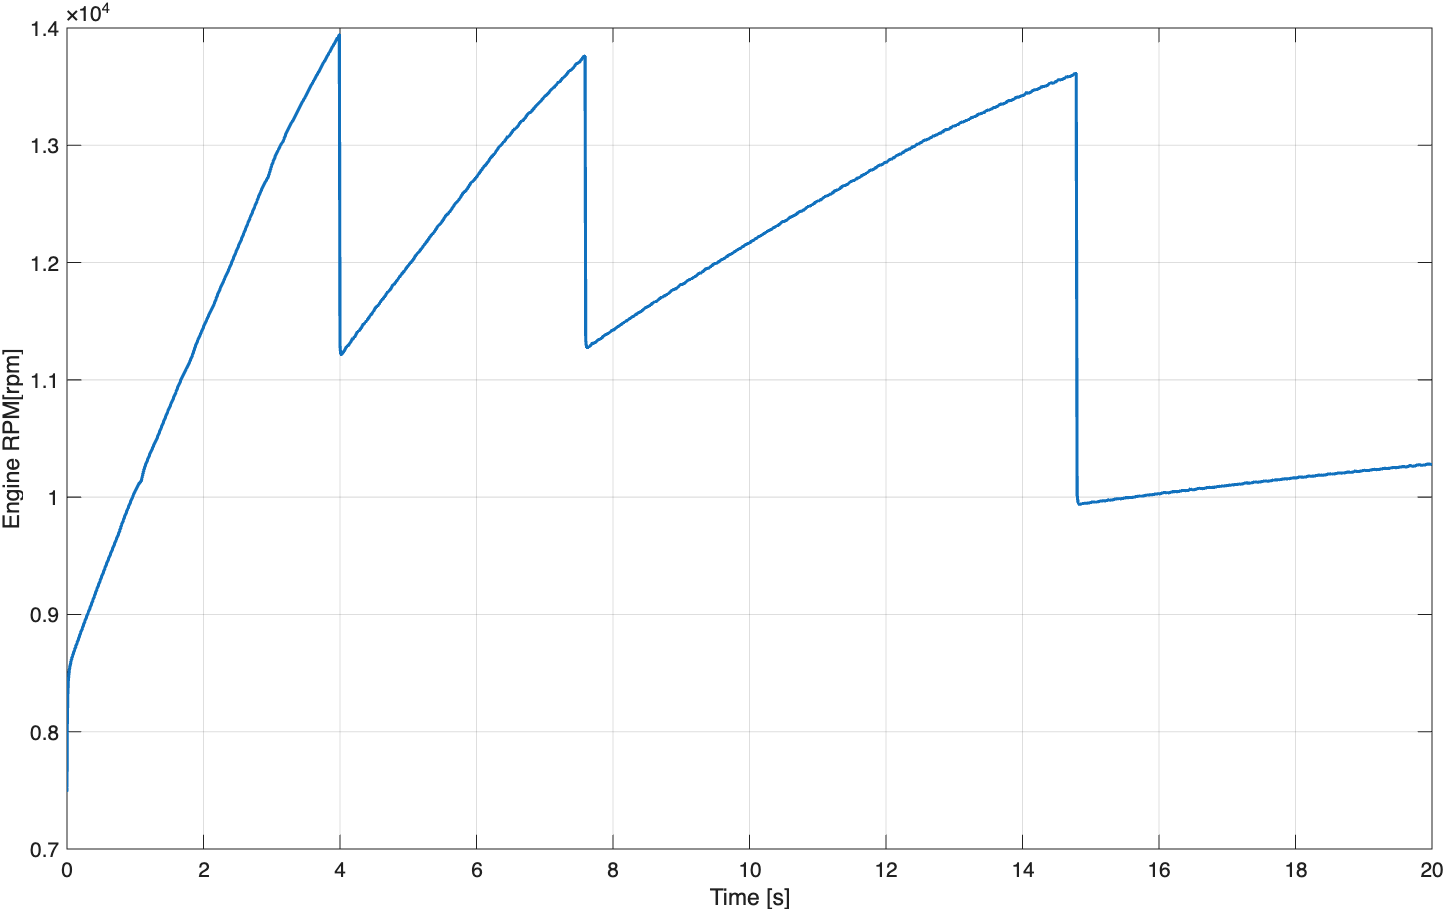
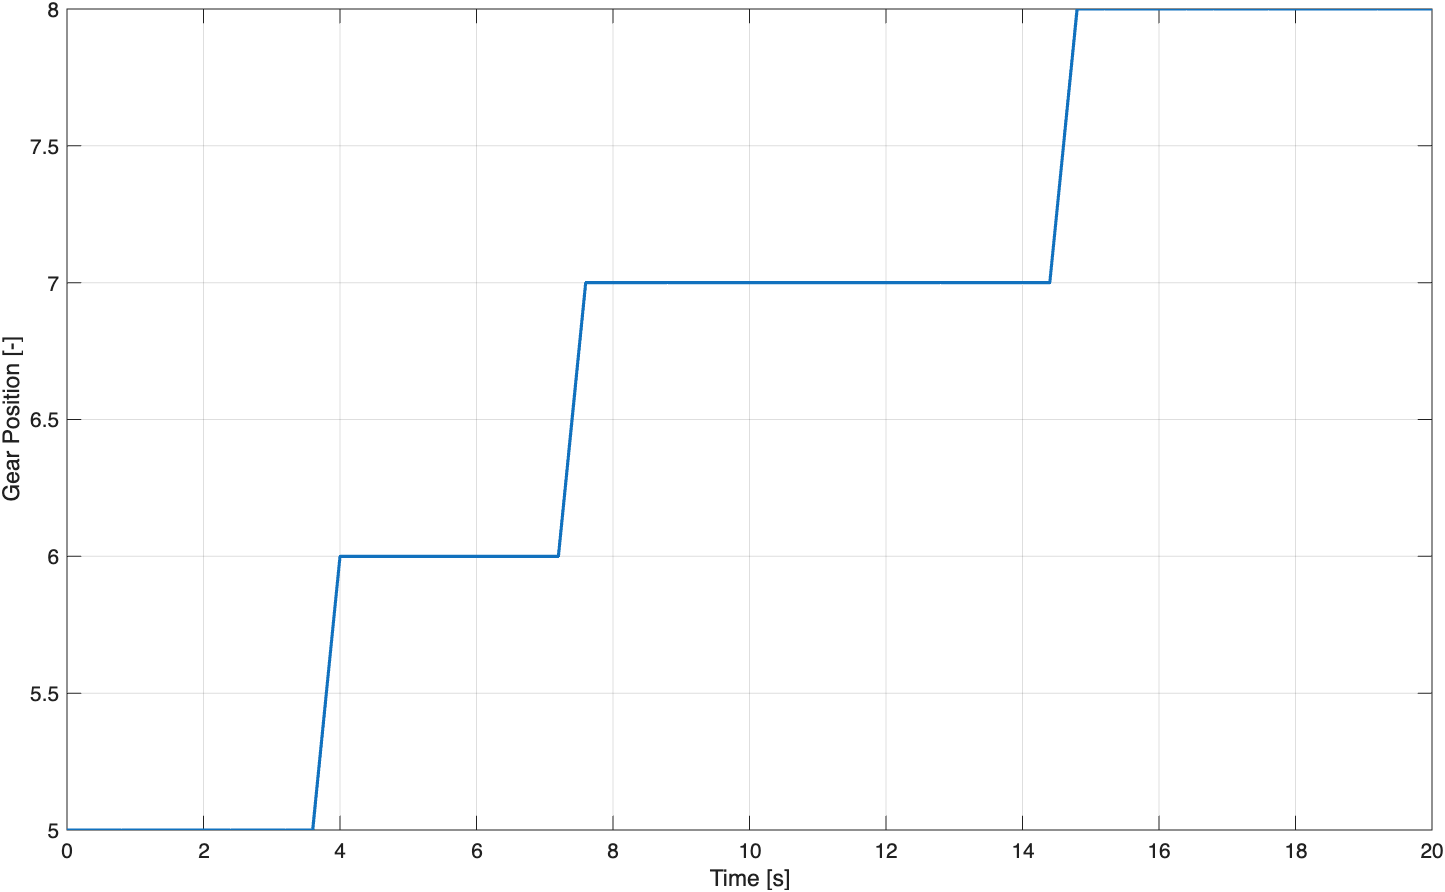
ENGINEERING INTERPRETATION
Engine speed rises towards the upshift threshold before dropping as each taller gear is selected. The corresponding gear-ratio reduction lowers wheel torque, producing visible steps in longitudinal acceleration. At the same time, aerodynamic drag grows with vehicle speed, reducing net accelerating force and progressively flattening the velocity trace.
05–06
NEXT DEVELOPMENT
Extension of the modelling suite into ride, heave, pitch and suspension response.
Frequency-domain investigation using controlled wheel inputs to study full-vehicle vertical response.